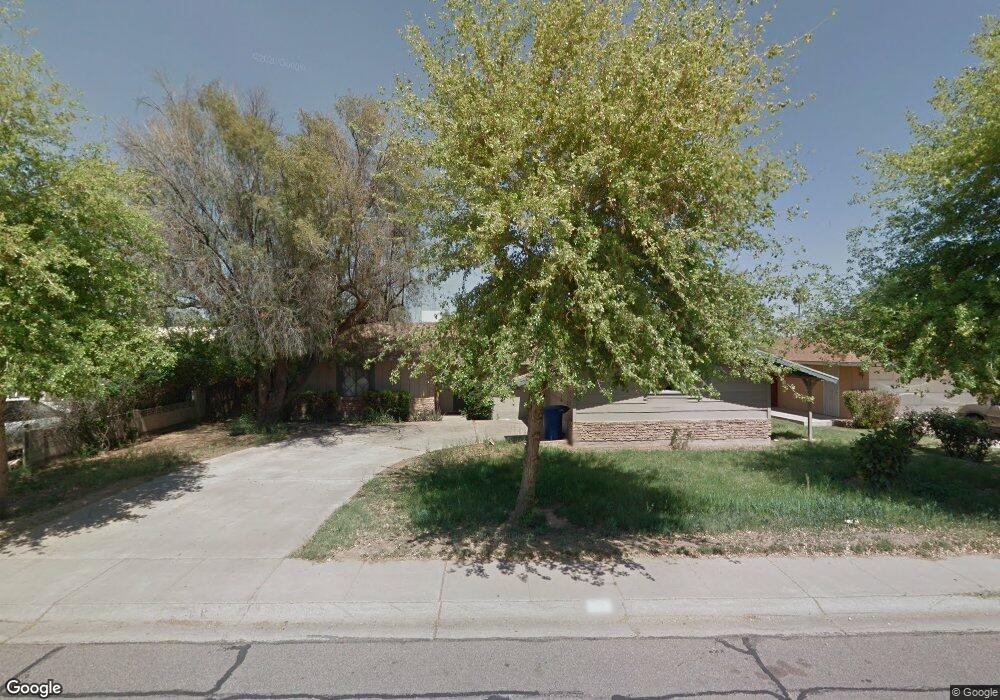
26 E Palmcroft Dr Tempe, AZ 85282
Alameda NeighborhoodEstimated Value: $516,228 - $564,000
3
Beds
2
Baths
1,600
Sq Ft
$340/Sq Ft
Est. Value
About This Home
This home is located at 26 E Palmcroft Dr, Tempe, AZ 85282 and is currently estimated at $543,307, approximately $339 per square foot. 26 E Palmcroft Dr is a home located in Maricopa County with nearby schools including Broadmor Elementary School, Connolly Middle School, and Tempe High School.
Ownership History
Date
Name
Owned For
Owner Type
Purchase Details
Closed on
May 25, 2022
Sold by
Brenan Poe
Bought by
Poe Family Trust
Current Estimated Value
Purchase Details
Closed on
Nov 18, 2011
Sold by
Matthews David L
Bought by
Poe Brenan
Home Financials for this Owner
Home Financials are based on the most recent Mortgage that was taken out on this home.
Original Mortgage
$167,639
Interest Rate
3.75%
Mortgage Type
FHA
Purchase Details
Closed on
Mar 22, 2007
Sold by
Mattier Laura B and Randleman Laura Beth
Bought by
Matthews David L
Home Financials for this Owner
Home Financials are based on the most recent Mortgage that was taken out on this home.
Original Mortgage
$269,800
Interest Rate
6.31%
Mortgage Type
New Conventional
Purchase Details
Closed on
Jan 10, 2002
Sold by
Randleman Earl W
Bought by
Randleman Earl W and Randleman Laura
Home Financials for this Owner
Home Financials are based on the most recent Mortgage that was taken out on this home.
Original Mortgage
$35,000
Interest Rate
7.01%
Create a Home Valuation Report for This Property
The Home Valuation Report is an in-depth analysis detailing your home's value as well as a comparison with similar homes in the area
Home Values in the Area
Average Home Value in this Area
Purchase History
| Date | Buyer | Sale Price | Title Company |
|---|---|---|---|
| Poe Family Trust | -- | None Listed On Document | |
| Poe Brenan | $175,000 | Guaranty Title Agency | |
| Matthews David L | $284,000 | Title Guaranty Agency Az Inc | |
| Randleman Earl W | -- | United Title Agency |
Source: Public Records
Mortgage History
| Date | Status | Borrower | Loan Amount |
|---|---|---|---|
| Previous Owner | Poe Brenan | $167,639 | |
| Previous Owner | Matthews David L | $269,800 | |
| Previous Owner | Randleman Earl W | $35,000 |
Source: Public Records
Tax History
| Year | Tax Paid | Tax Assessment Tax Assessment Total Assessment is a certain percentage of the fair market value that is determined by local assessors to be the total taxable value of land and additions on the property. | Land | Improvement |
|---|---|---|---|---|
| 2025 | $2,766 | $26,527 | -- | -- |
| 2024 | $2,538 | $25,264 | -- | -- |
| 2023 | $2,538 | $43,620 | $8,720 | $34,900 |
| 2022 | $2,423 | $31,720 | $6,340 | $25,380 |
| 2021 | $2,471 | $29,330 | $5,860 | $23,470 |
| 2020 | $2,389 | $27,260 | $5,450 | $21,810 |
| 2019 | $2,343 | $29,750 | $5,950 | $23,800 |
| 2018 | $2,280 | $30,260 | $6,050 | $24,210 |
| 2017 | $2,209 | $25,300 | $5,060 | $20,240 |
| 2016 | $2,199 | $26,870 | $5,370 | $21,500 |
| 2015 | $2,126 | $21,530 | $4,300 | $17,230 |
Source: Public Records
Map
Nearby Homes
- 122 W Cottage Ln
- 151 E Broadway Rd Unit 103
- 151 E Broadway Rd Unit 102
- 16 W Loma Vista Dr Unit 104
- 2007 S El Camino Dr
- 325 E Aepli Dr
- 17 E Cairo Dr
- 346 E Broadway Ln
- 2227 S Sierra Vista Dr
- 22 E 15th St
- 504 W 17th Place
- 533 W 18th St
- 3 E Erie Dr
- 216 E 15th St
- 233 E Erie Dr
- 63 W 13th St Unit 63 & 69
- 611 E Encanto Dr
- 535 W 15th St
- 720 E Broadway Ln
- 620 E Encanto Dr
- 34 E Palmcroft Dr
- 18 E Palmcroft Dr
- 37 E El Parque Dr Unit A
- 37 E El Parque Dr
- 33 E El Parque Dr
- 12 E Palmcroft Dr
- 42 E Palmcroft Dr
- 44 E Palmcroft Dr
- 27 E Palmcroft Dr
- 17 E Palmcroft Dr
- 33 E Palmcroft Dr
- 11 E Palmcroft Dr
- 50 E Palmcroft Dr
- 41 E Palmcroft Dr
- 2121 S Mill Ave
- 108 E Palmcroft Dr
- 36 E El Parque Dr
- 2104 E Fiesta Dr
- 49 E Palmcroft Dr
- 2205 S Mill Ave Unit 4
Your Personal Tour Guide
Ask me questions while you tour the home.