26 Elmore Ave Unit 28 Springfield, MA 01119
Boston Road NeighborhoodEstimated Value: $398,134 - $434,000
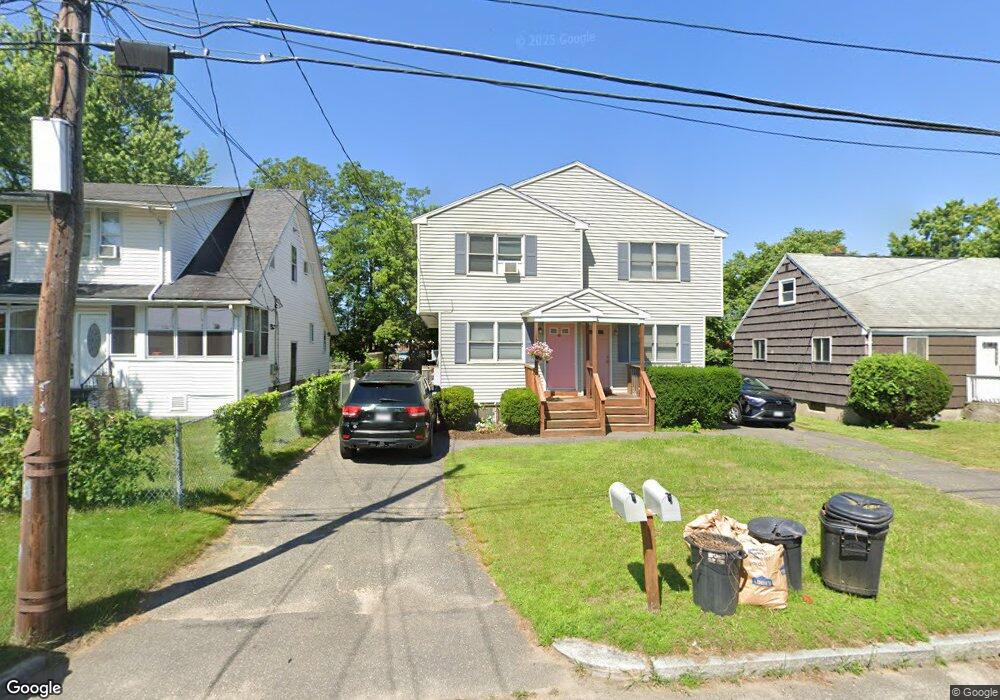
About This Home
This home is located at 26 Elmore Ave Unit 28, Springfield, MA 01119 and is currently estimated at $413,284, approximately $191 per square foot. 26 Elmore Ave Unit 28 is a home located in Hampden County with nearby schools including Frank H. Freedman School, John F. Kennedy Academy, and Springfield Central High School.
Ownership History
We collect this data history from publicly available records. To have your information removed, we recommend requesting removal directly through your county’s website.
Purchase Details
Home Financials for this Owner
Home Financials are based on the most recent Mortgage that was taken out on this home.Home Values in the Area
Average Home Value in this Area
Purchase History
We collect this data history from publicly available records. To have your information removed, we recommend requesting removal directly through your county’s website.
| Date | Buyer | Sale Price | Title Company |
|---|---|---|---|
| $10,000 | -- |
Mortgage History
We collect this data history from publicly available records. To have your information removed, we recommend requesting removal directly through your county’s website.
| Date | Status | Borrower | Loan Amount |
|---|---|---|---|
| Closed | $85,000 |
Tax History
We collect this data history from publicly available records. To have your information removed, we recommend requesting removal directly through your county’s website.
| Year | Tax Paid | Tax Assessment Tax Assessment Total Assessment is a certain percentage of the fair market value that is determined by local assessors to be the total taxable value of land and additions on the property. | Land | Improvement |
|---|---|---|---|---|
| 2025 | $5,825 | $371,500 | $43,000 | $328,500 |
| 2024 | $5,387 | $335,400 | $40,200 | $295,200 |
| 2023 | $4,948 | $290,200 | $38,300 | $251,900 |
| 2022 | $4,178 | $222,000 | $38,300 | $183,700 |
| 2021 | $3,876 | $205,100 | $34,800 | $170,300 |
| 2020 | $3,756 | $192,300 | $34,800 | $157,500 |
| 2019 | $3,479 | $176,800 | $34,800 | $142,000 |
| 2018 | $3,413 | $173,400 | $34,800 | $138,600 |
| 2017 | $3,558 | $181,000 | $34,800 | $146,200 |
| 2016 | $3,458 | $175,900 | $34,800 | $141,100 |
| 2015 | -- | $169,100 | $34,800 | $134,300 |
Map
- 7 Brandon Ave
- - Glenwood St
- 12 Angelo St
- 63 Hope St
- 81 Arey St
- 0 Barnard Ct (Es)
- 70 Shumway St Unit 29
- 106 Almira Rd
- 11 Lamplighter Ln
- 22 Contessa Dr
- 188 Wollaston St
- 16 Mobile Home Way
- 21 Fullerton St
- 16 Pioneer Way
- 232 Almira Rd
- 65 Fargo St
- 67 Fieldston St
- 81-83 Blanding St
- 164 Arnold Ave
- 0 Wrentham Rd (Ws) Unit 73545186
- 36 Elmore Ave
- 30 Elmore Ave
- 40 Elmore Ave
- 46 Elmore Ave
- 22 Elmore Ave
- 35 Elmore Ave
- 39 Elmore Ave
- 27 Elmore Ave
- 50 Elmore Ave
- 45 Elmore Ave
- 49 Elmore Ave
- 34 Brandon Ave
- 55 Elmore Ave
- 60 Elmore Ave
- 32 Brandon Ave
- 40 Brandon Ave
- 30 Brandon Ave
- 44-46 Brandon Ave
- 44 Brandon Ave Unit 46
- 44 Brandon Ave Unit 44
Ask me questions while you tour the home.