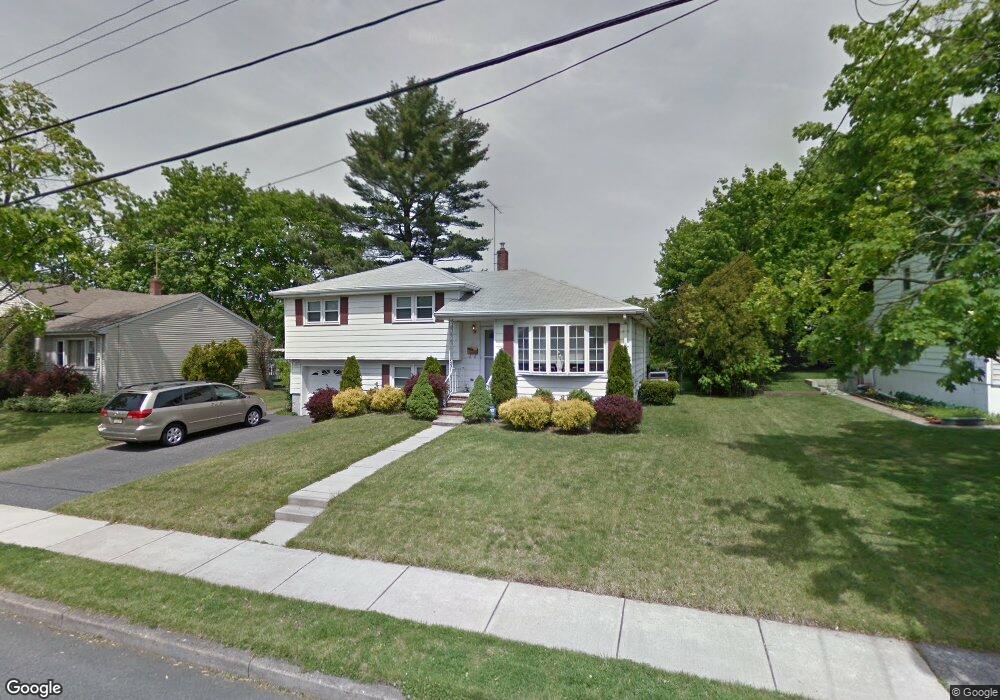
26 Essex Place Dumont, NJ 07628
Estimated Value: $677,000 - $723,000
--
Bed
--
Bath
1,615
Sq Ft
$431/Sq Ft
Est. Value
About This Home
This home is located at 26 Essex Place, Dumont, NJ 07628 and is currently estimated at $695,658, approximately $430 per square foot. 26 Essex Place is a home located in Bergen County with nearby schools including Dumont High School.
Ownership History
Date
Name
Owned For
Owner Type
Purchase Details
Closed on
Feb 17, 2021
Sold by
Muffoletto Stephanie and Farruggio Stephanie
Bought by
Farruggio Stephanie
Current Estimated Value
Home Financials for this Owner
Home Financials are based on the most recent Mortgage that was taken out on this home.
Original Mortgage
$185,000
Outstanding Balance
$165,747
Interest Rate
2.8%
Mortgage Type
New Conventional
Estimated Equity
$529,911
Purchase Details
Closed on
Mar 13, 2014
Sold by
Muffoletto Vincent J and Muffoletto Stephanie
Bought by
Muffoletto Stephanie
Purchase Details
Closed on
Jan 28, 2002
Sold by
Fontana Anthony N
Bought by
Muffoletto Vincent J and Muffoletto Stephanei
Home Financials for this Owner
Home Financials are based on the most recent Mortgage that was taken out on this home.
Original Mortgage
$235,000
Interest Rate
7.14%
Create a Home Valuation Report for This Property
The Home Valuation Report is an in-depth analysis detailing your home's value as well as a comparison with similar homes in the area
Home Values in the Area
Average Home Value in this Area
Purchase History
| Date | Buyer | Sale Price | Title Company |
|---|---|---|---|
| Farruggio Stephanie | -- | Mortgage Connect Lp | |
| Muffoletto Stephanie | $189,225 | -- | |
| Muffoletto Vincent J | $325,000 | -- |
Source: Public Records
Mortgage History
| Date | Status | Borrower | Loan Amount |
|---|---|---|---|
| Open | Farruggio Stephanie | $185,000 | |
| Previous Owner | Muffoletto Vincent J | $235,000 |
Source: Public Records
Tax History Compared to Growth
Tax History
| Year | Tax Paid | Tax Assessment Tax Assessment Total Assessment is a certain percentage of the fair market value that is determined by local assessors to be the total taxable value of land and additions on the property. | Land | Improvement |
|---|---|---|---|---|
| 2025 | $13,443 | $580,200 | $335,500 | $244,700 |
| 2024 | $13,112 | $330,700 | $180,800 | $149,900 |
| 2023 | $12,841 | $330,700 | $180,800 | $149,900 |
| 2022 | $12,841 | $330,700 | $180,800 | $149,900 |
| 2021 | $12,778 | $330,700 | $180,800 | $149,900 |
| 2020 | $12,281 | $326,700 | $180,800 | $145,900 |
| 2019 | $11,987 | $326,700 | $180,800 | $145,900 |
| 2018 | $11,742 | $326,700 | $180,800 | $145,900 |
| 2017 | $11,516 | $326,700 | $180,800 | $145,900 |
| 2016 | $11,248 | $326,700 | $180,800 | $145,900 |
| 2015 | $10,990 | $326,700 | $180,800 | $145,900 |
| 2014 | $10,775 | $326,700 | $180,800 | $145,900 |
Source: Public Records
Map
Nearby Homes