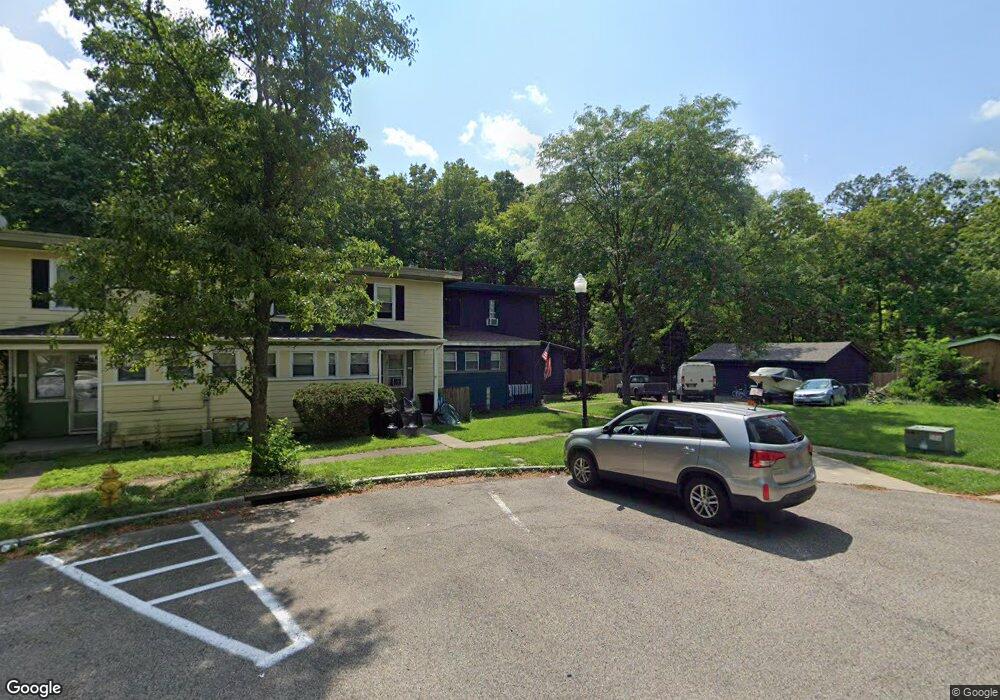
26 Falcon Ln Cincinnati, OH 45218
Estimated Value: $156,000 - $209,000
4
Beds
2
Baths
1,798
Sq Ft
$101/Sq Ft
Est. Value
About This Home
This home is located at 26 Falcon Ln, Cincinnati, OH 45218 and is currently estimated at $181,617, approximately $101 per square foot. 26 Falcon Ln is a home located in Hamilton County with nearby schools including Central Montessori Academy and John Paul II Catholic School.
Ownership History
Date
Name
Owned For
Owner Type
Purchase Details
Closed on
Sep 28, 2018
Sold by
Hartmann Richard J
Bought by
Bass Bryan S and Bass Marilyn
Current Estimated Value
Home Financials for this Owner
Home Financials are based on the most recent Mortgage that was taken out on this home.
Original Mortgage
$33,950
Outstanding Balance
$29,606
Interest Rate
4.5%
Mortgage Type
New Conventional
Estimated Equity
$152,011
Purchase Details
Closed on
Apr 28, 1995
Sold by
Dinkelacker Raymond W and Dinkelacker Kathryn F
Bought by
Auer Mark M and Auer Kimberly M
Home Financials for this Owner
Home Financials are based on the most recent Mortgage that was taken out on this home.
Original Mortgage
$60,000
Interest Rate
8.43%
Create a Home Valuation Report for This Property
The Home Valuation Report is an in-depth analysis detailing your home's value as well as a comparison with similar homes in the area
Home Values in the Area
Average Home Value in this Area
Purchase History
| Date | Buyer | Sale Price | Title Company |
|---|---|---|---|
| Bass Bryan S | $35,000 | None Available | |
| Auer Mark M | -- | -- |
Source: Public Records
Mortgage History
| Date | Status | Borrower | Loan Amount |
|---|---|---|---|
| Open | Bass Bryan S | $33,950 | |
| Previous Owner | Auer Mark M | $60,000 |
Source: Public Records
Tax History Compared to Growth
Tax History
| Year | Tax Paid | Tax Assessment Tax Assessment Total Assessment is a certain percentage of the fair market value that is determined by local assessors to be the total taxable value of land and additions on the property. | Land | Improvement |
|---|---|---|---|---|
| 2024 | $1,811 | $36,750 | $10,255 | $26,495 |
| 2023 | $2,548 | $49,865 | $10,255 | $39,610 |
| 2022 | $344 | $12,251 | $8,558 | $3,693 |
| 2021 | $329 | $12,251 | $8,558 | $3,693 |
| 2020 | $344 | $12,251 | $8,558 | $3,693 |
| 2019 | $2,026 | $30,034 | $7,315 | $22,719 |
| 2018 | $2,943 | $30,034 | $7,315 | $22,719 |
| 2017 | $2,770 | $30,034 | $7,315 | $22,719 |
| 2016 | $3,265 | $34,276 | $8,148 | $26,128 |
| 2015 | $3,034 | $34,276 | $8,148 | $26,128 |
| 2014 | $3,099 | $34,276 | $8,148 | $26,128 |
| 2013 | $2,979 | $35,336 | $8,400 | $26,936 |
Source: Public Records
Map
Nearby Homes