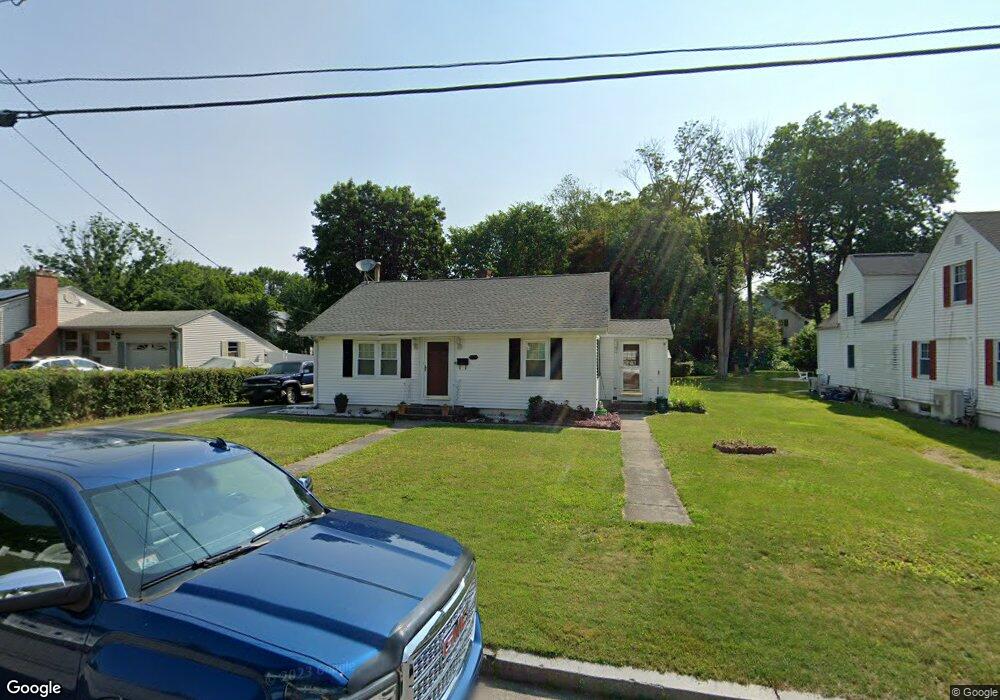
26 Falcon St Worcester, MA 01603
Webster Square NeighborhoodEstimated Value: $347,769 - $421,000
2
Beds
1
Bath
896
Sq Ft
$413/Sq Ft
Est. Value
About This Home
This home is located at 26 Falcon St, Worcester, MA 01603 and is currently estimated at $369,942, approximately $412 per square foot. 26 Falcon St is a home located in Worcester County with nearby schools including Jacob Hiatt Magnet School, Chandler Magnet, and Heard Street Discovery Academy.
Ownership History
Date
Name
Owned For
Owner Type
Purchase Details
Closed on
Mar 31, 2010
Sold by
Hud-Sons Rt and Hudson Susan M
Bought by
Nguyen Truc N
Current Estimated Value
Home Financials for this Owner
Home Financials are based on the most recent Mortgage that was taken out on this home.
Original Mortgage
$123,750
Outstanding Balance
$82,176
Interest Rate
4.94%
Mortgage Type
Purchase Money Mortgage
Estimated Equity
$287,766
Purchase Details
Closed on
Sep 6, 2001
Sold by
Lavallee Louise A and Dombroski Laura J
Bought by
Hudson William B and Hudson Susan M
Home Financials for this Owner
Home Financials are based on the most recent Mortgage that was taken out on this home.
Original Mortgage
$86,400
Interest Rate
7.05%
Mortgage Type
Purchase Money Mortgage
Create a Home Valuation Report for This Property
The Home Valuation Report is an in-depth analysis detailing your home's value as well as a comparison with similar homes in the area
Home Values in the Area
Average Home Value in this Area
Purchase History
| Date | Buyer | Sale Price | Title Company |
|---|---|---|---|
| Nguyen Truc N | $165,000 | -- | |
| Hudson William B | $123,500 | -- |
Source: Public Records
Mortgage History
| Date | Status | Borrower | Loan Amount |
|---|---|---|---|
| Open | Nguyen Truc N | $123,750 | |
| Previous Owner | Hudson William B | $89,000 | |
| Previous Owner | Hudson William B | $86,400 |
Source: Public Records
Tax History
| Year | Tax Paid | Tax Assessment Tax Assessment Total Assessment is a certain percentage of the fair market value that is determined by local assessors to be the total taxable value of land and additions on the property. | Land | Improvement |
|---|---|---|---|---|
| 2025 | $3,953 | $299,700 | $99,000 | $200,700 |
| 2024 | $3,872 | $281,600 | $99,000 | $182,600 |
| 2023 | $3,737 | $260,600 | $86,100 | $174,500 |
| 2022 | $3,304 | $217,200 | $68,800 | $148,400 |
| 2021 | $3,145 | $193,200 | $55,100 | $138,100 |
| 2020 | $3,014 | $177,300 | $54,600 | $122,700 |
| 2019 | $2,808 | $156,000 | $47,900 | $108,100 |
| 2018 | $2,719 | $143,800 | $47,900 | $95,900 |
| 2017 | $2,712 | $141,100 | $47,900 | $93,200 |
| 2016 | $2,632 | $127,700 | $35,200 | $92,500 |
| 2015 | $2,563 | $127,700 | $35,200 | $92,500 |
| 2014 | $2,495 | $127,700 | $35,200 | $92,500 |
Source: Public Records
Map
Nearby Homes
- 55 Grandview Ave
- 35 Genessee St Unit E
- 13 Merchant St
- 103 Henshaw St
- 32 Goddard Memorial Dr
- 1511 Main St Unit C405
- 76 Parsons Hill Dr Unit A
- 315 Stafford St
- 26 Sylvan St
- 27 Havana Rd
- 128 Wildwood Ave
- 23B Timrod Dr
- 25 Wyola Dr
- 11 Timrod Dr
- 99 Clover St
- 2 Montague St
- 31 B Gates Rd Unit 22R
- 23 Lakewood St
- 57 1st St
- 34 Scandinavia Ave
Your Personal Tour Guide
Ask me questions while you tour the home.