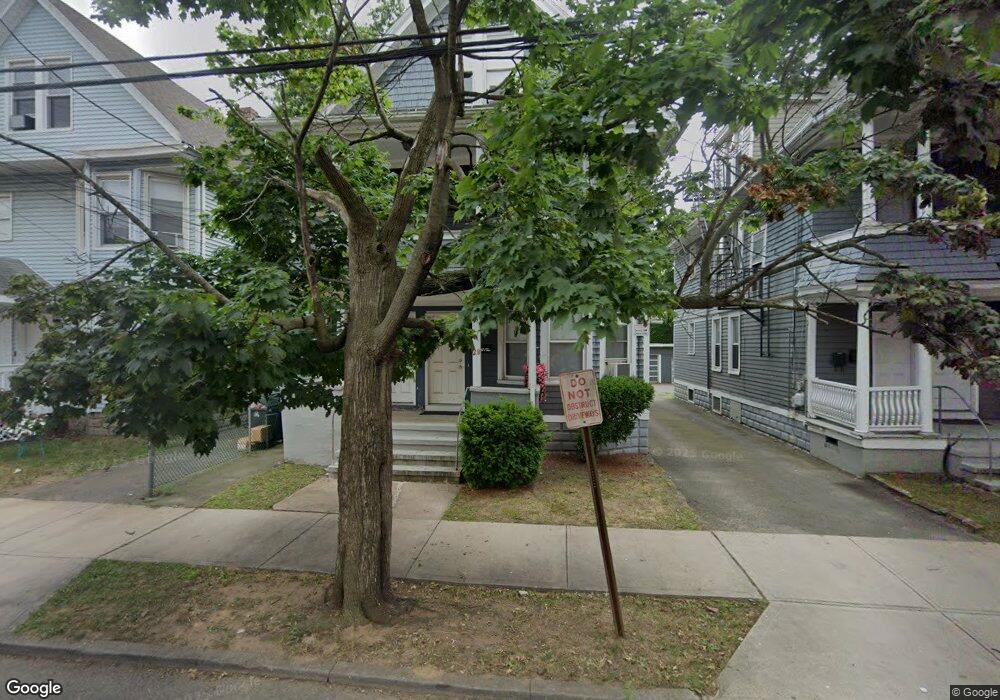
26 Fox St New Haven, CT 06513
Fair Haven NeighborhoodEstimated Value: $269,000 - $370,000
3
Beds
3
Baths
2,392
Sq Ft
$134/Sq Ft
Est. Value
About This Home
This home is located at 26 Fox St, New Haven, CT 06513 and is currently estimated at $319,333, approximately $133 per square foot. 26 Fox St is a home located in New Haven County with nearby schools including Clinton Avenue School, Elm City College Preparatory School, and St Francis & St Rose Of Lima School.
Ownership History
Date
Name
Owned For
Owner Type
Purchase Details
Closed on
Feb 6, 2023
Sold by
Bentzy V De Llc
Bought by
Tishman Doron
Current Estimated Value
Purchase Details
Closed on
Nov 4, 2022
Sold by
Inner City Home Buyers
Bought by
Bentzy 5 De Llc
Purchase Details
Closed on
Oct 27, 2022
Sold by
Izzo Anthony D
Bought by
Inner City Home Buyers
Create a Home Valuation Report for This Property
The Home Valuation Report is an in-depth analysis detailing your home's value as well as a comparison with similar homes in the area
Home Values in the Area
Average Home Value in this Area
Purchase History
| Date | Buyer | Sale Price | Title Company |
|---|---|---|---|
| Tishman Doron | -- | None Available | |
| Bentzy 5 De Llc | -- | None Available | |
| Inner City Home Buyers | $625,000 | None Available |
Source: Public Records
Tax History Compared to Growth
Tax History
| Year | Tax Paid | Tax Assessment Tax Assessment Total Assessment is a certain percentage of the fair market value that is determined by local assessors to be the total taxable value of land and additions on the property. | Land | Improvement |
|---|---|---|---|---|
| 2025 | $6,012 | $152,600 | $26,880 | $125,720 |
| 2024 | $5,875 | $152,600 | $26,880 | $125,720 |
| 2023 | $5,677 | $152,600 | $26,880 | $125,720 |
| 2022 | $6,066 | $152,600 | $26,880 | $125,720 |
| 2021 | $4,018 | $91,560 | $21,560 | $70,000 |
| 2020 | $4,018 | $91,560 | $21,560 | $70,000 |
| 2019 | $3,935 | $91,560 | $21,560 | $70,000 |
| 2018 | $3,935 | $91,560 | $21,560 | $70,000 |
| 2017 | $3,542 | $91,560 | $21,560 | $70,000 |
| 2016 | $2,903 | $69,860 | $14,350 | $55,510 |
| 2015 | $2,903 | $69,860 | $14,350 | $55,510 |
| 2014 | $2,903 | $69,860 | $14,350 | $55,510 |
Source: Public Records
Map
Nearby Homes