C
Seller's Agent in 2025
Carey Shores
BHHS Bay Street Realty Group
(912) 233-6000
Estimated Value: $565,000 - $577,649
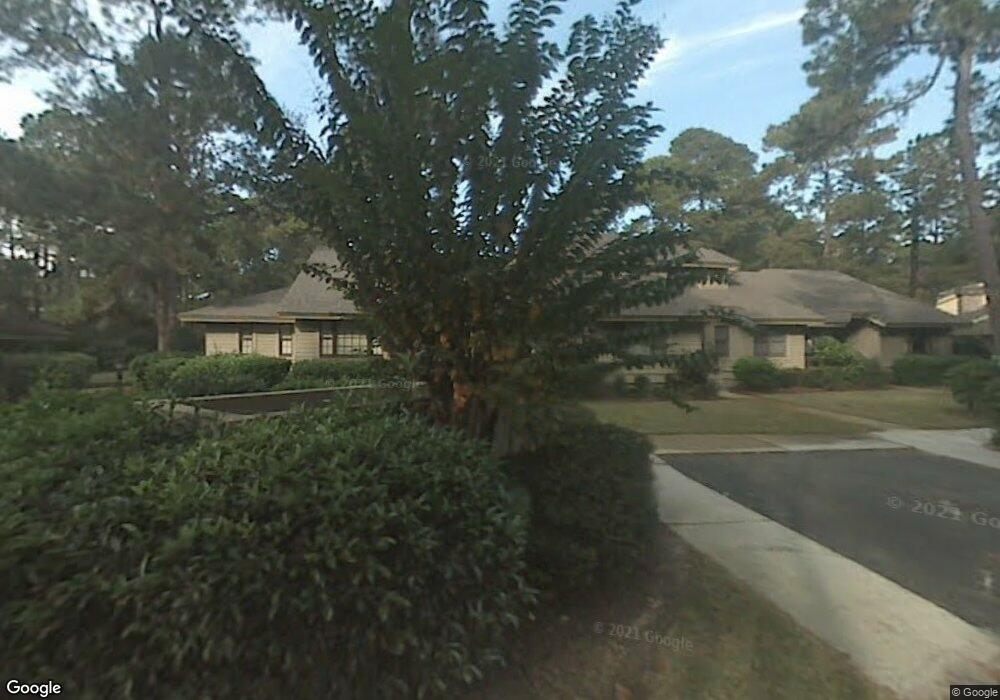
This home is located at 26 Franklin Creek Rd N, Savannah, GA 31411 and is currently estimated at $571,162, approximately $253 per square foot. 26 Franklin Creek Rd N is a home located in Chatham County with nearby schools including Hesse School and Jenkins High School.
| Date | Buyer | Sale Price | Title Company |
|---|---|---|---|
| Farnsworth Jack L | $550,000 | -- | |
| Dunleavy Joseph E | $420,000 | -- | |
| Herring Joseph L | $270,000 | -- | |
| Murck Sanford C | $285,000 | -- | |
| Rudnitsky Paul | $325,000 | -- |
| Date | Status | Borrower | Loan Amount |
|---|---|---|---|
| Previous Owner | Rudnitsky Paul | $175,000 |
| Date | Event | Price | List to Sale | Price per Sq Ft | Prior Sale |
|---|---|---|---|---|---|
| 02/25/2025 02/25/25 | Sold | $550,000 | -6.6% | $244 / Sq Ft | View Prior Sale |
| 02/12/2025 02/12/25 | Pending | -- | -- | -- | |
| 01/20/2025 01/20/25 | Price Changed | $589,000 | -7.8% | $262 / Sq Ft | |
| 12/06/2024 12/06/24 | For Sale | $639,000 | +52.1% | $284 / Sq Ft | |
| 11/30/2021 11/30/21 | Sold | $420,000 | 0.0% | $198 / Sq Ft | View Prior Sale |
| 11/06/2021 11/06/21 | Pending | -- | -- | -- | |
| 10/29/2021 10/29/21 | For Sale | $419,900 | +55.5% | $198 / Sq Ft | |
| 08/11/2020 08/11/20 | Sold | $270,000 | 0.0% | $145 / Sq Ft | View Prior Sale |
| 05/14/2020 05/14/20 | Off Market | $270,000 | -- | -- | |
| 05/07/2020 05/07/20 | Price Changed | $289,500 | 0.0% | $156 / Sq Ft | |
| 05/07/2020 05/07/20 | For Sale | $289,500 | -1.0% | $156 / Sq Ft | |
| 03/04/2020 03/04/20 | For Sale | $292,500 | +2.6% | $157 / Sq Ft | |
| 07/17/2017 07/17/17 | Sold | $285,000 | -1.4% | $153 / Sq Ft | View Prior Sale |
| 04/07/2017 04/07/17 | Pending | -- | -- | -- | |
| 02/13/2017 02/13/17 | For Sale | $289,000 | -- | $156 / Sq Ft |
| Year | Tax Paid | Tax Assessment Tax Assessment Total Assessment is a certain percentage of the fair market value that is determined by local assessors to be the total taxable value of land and additions on the property. | Land | Improvement |
|---|---|---|---|---|
| 2025 | $3,785 | $215,600 | $50,000 | $165,600 |
| 2024 | $3,785 | $199,080 | $44,000 | $155,080 |
| 2023 | $2,992 | $178,480 | $34,000 | $144,480 |
| 2022 | $3,826 | $160,680 | $28,000 | $132,680 |
| 2021 | $4,489 | $107,400 | $28,000 | $79,400 |
| 2020 | $2,678 | $103,400 | $28,000 | $75,400 |
| 2019 | $2,763 | $103,400 | $28,000 | $75,400 |
| 2018 | $3,499 | $102,240 | $28,000 | $74,240 |
| 2017 | $3,415 | $104,400 | $28,000 | $76,400 |
| 2016 | $3,457 | $102,520 | $28,000 | $74,520 |
| 2015 | $3,156 | $93,320 | $22,520 | $70,800 |
| 2014 | $4,088 | $82,160 | $0 | $0 |
C
Seller's Agent in 2025
Carey Shores
BHHS Bay Street Realty Group
(912) 233-6000
M
Seller Co-Listing Agent in 2025
Morgan Sheffield
BHHS Bay Street Realty Group
(912) 665-3247

Buyer's Agent in 2025
GLENDA GANEM
BHHS Bay Street Realty Group
(912) 695-1715
Seller's Agent in 2021
Reba Laramy
BHHS Bay Street Realty Group
(912) 596-1294
J
Seller's Agent in 2020
Judy A. Green
The Landings Real Estate Co
(912) 484-2981
Seller Co-Listing Agent in 2020
Angela Sauers
The Landings Real Estate Co
(912) 272-1435