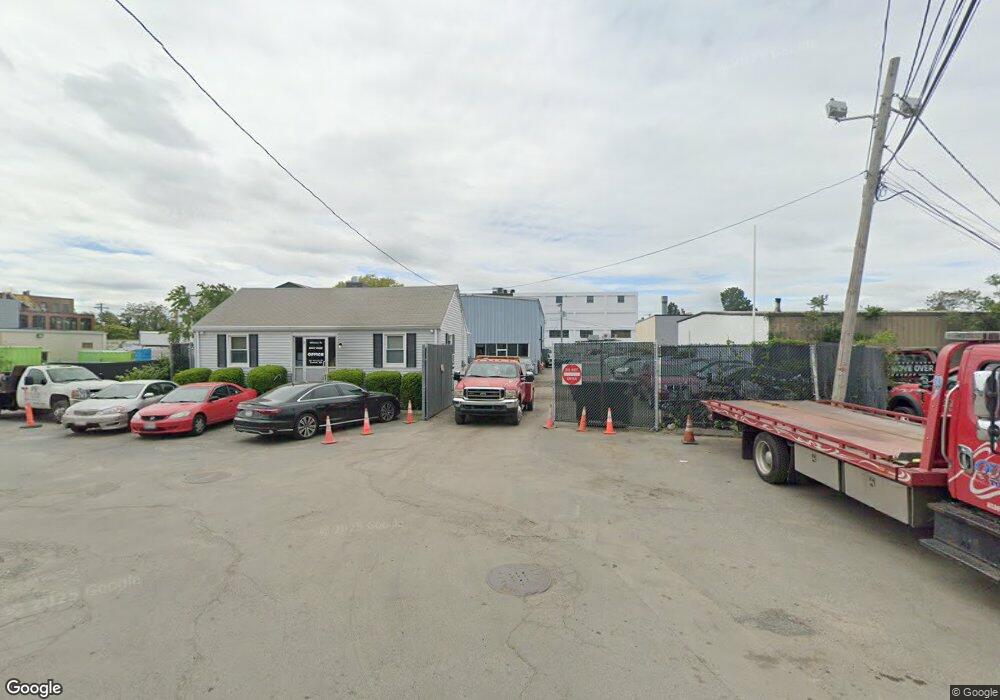
26 Garvey St Everett, MA 02149
Estimated Value: $18,214,412
--
Bed
--
Bath
3,000
Sq Ft
$6,071/Sq Ft
Est. Value
About This Home
This home is located at 26 Garvey St, Everett, MA 02149 and is currently estimated at $18,214,412, approximately $6,071 per square foot. 26 Garvey St is a home located in Middlesex County with nearby schools including Everett High School, Pioneer Charter School of Science, and St Anthony School.
Ownership History
Date
Name
Owned For
Owner Type
Purchase Details
Closed on
Oct 18, 2006
Sold by
Garvey Street Rt
Bought by
26 Garvey Street Rt
Current Estimated Value
Home Financials for this Owner
Home Financials are based on the most recent Mortgage that was taken out on this home.
Original Mortgage
$875,000
Outstanding Balance
$522,995
Interest Rate
6.49%
Mortgage Type
Commercial
Estimated Equity
$17,691,417
Purchase Details
Closed on
Oct 27, 1993
Sold by
Harold C Currier Jr Ft
Bought by
Krapish Gary A
Create a Home Valuation Report for This Property
The Home Valuation Report is an in-depth analysis detailing your home's value as well as a comparison with similar homes in the area
Home Values in the Area
Average Home Value in this Area
Purchase History
| Date | Buyer | Sale Price | Title Company |
|---|---|---|---|
| 26 Garvey Street Rt | $875,000 | -- | |
| 26 Garvey Street Rt | $875,000 | -- | |
| Krapish Gary A | $125,000 | -- |
Source: Public Records
Mortgage History
| Date | Status | Borrower | Loan Amount |
|---|---|---|---|
| Open | 26 Garvey Street Rt | $875,000 | |
| Closed | 26 Garvey Street Rt | $875,000 |
Source: Public Records
Tax History Compared to Growth
Tax History
| Year | Tax Paid | Tax Assessment Tax Assessment Total Assessment is a certain percentage of the fair market value that is determined by local assessors to be the total taxable value of land and additions on the property. | Land | Improvement |
|---|---|---|---|---|
| 2025 | $0 | $909,400 | $660,200 | $249,200 |
| 2024 | $0 | $854,000 | $618,000 | $236,000 |
| 2023 | $0 | $656,300 | $597,000 | $59,300 |
| 2022 | $0 | $791,800 | $568,900 | $222,900 |
| 2021 | $0 | $753,100 | $540,800 | $212,300 |
| 2020 | $17,010 | $688,100 | $491,600 | $196,500 |
| 2019 | $24,093 | $683,100 | $491,600 | $191,500 |
| 2018 | $17,305 | $512,900 | $339,200 | $173,700 |
| 2017 | $17,228 | $482,700 | $314,900 | $167,800 |
| 2016 | $18,333 | $482,700 | $314,900 | $167,800 |
| 2015 | $18,289 | $463,600 | $290,700 | $172,900 |
Source: Public Records
Map
Nearby Homes