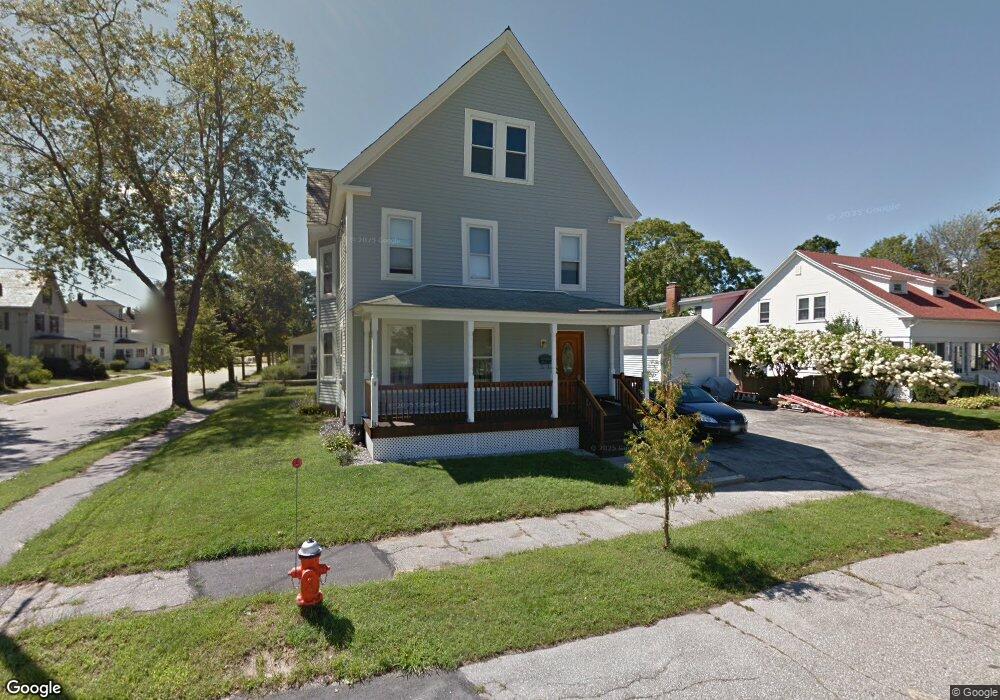
26 Gilmore St Concord, NH 03301
South End NeighborhoodEstimated Value: $463,420 - $514,000
3
Beds
2
Baths
1,678
Sq Ft
$291/Sq Ft
Est. Value
About This Home
This home is located at 26 Gilmore St, Concord, NH 03301 and is currently estimated at $488,855, approximately $291 per square foot. 26 Gilmore St is a home located in Merrimack County with nearby schools including Abbot-Downing School, Rundlett Middle School, and Concord High School.
Ownership History
Date
Name
Owned For
Owner Type
Purchase Details
Closed on
Oct 28, 2015
Sold by
Barbara J Tucker Irt
Bought by
Bouvier Bruce R and Bouvier Sherri R
Current Estimated Value
Home Financials for this Owner
Home Financials are based on the most recent Mortgage that was taken out on this home.
Original Mortgage
$165,000
Outstanding Balance
$132,091
Interest Rate
3.92%
Mortgage Type
New Conventional
Estimated Equity
$356,764
Create a Home Valuation Report for This Property
The Home Valuation Report is an in-depth analysis detailing your home's value as well as a comparison with similar homes in the area
Home Values in the Area
Average Home Value in this Area
Purchase History
| Date | Buyer | Sale Price | Title Company |
|---|---|---|---|
| Bouvier Bruce R | $210,000 | -- |
Source: Public Records
Mortgage History
| Date | Status | Borrower | Loan Amount |
|---|---|---|---|
| Open | Bouvier Bruce R | $165,000 |
Source: Public Records
Tax History Compared to Growth
Tax History
| Year | Tax Paid | Tax Assessment Tax Assessment Total Assessment is a certain percentage of the fair market value that is determined by local assessors to be the total taxable value of land and additions on the property. | Land | Improvement |
|---|---|---|---|---|
| 2024 | $8,540 | $308,400 | $119,900 | $188,500 |
| 2023 | $8,284 | $308,400 | $119,900 | $188,500 |
| 2022 | $7,984 | $308,400 | $119,900 | $188,500 |
| 2021 | $7,747 | $308,400 | $119,900 | $188,500 |
| 2020 | $7,640 | $285,500 | $100,400 | $185,100 |
| 2019 | $7,112 | $256,000 | $97,700 | $158,300 |
| 2018 | $7,025 | $249,200 | $101,000 | $148,200 |
| 2017 | $6,738 | $238,600 | $101,000 | $137,600 |
| 2016 | $6,403 | $231,400 | $99,100 | $132,300 |
| 2015 | $5,676 | $214,700 | $111,000 | $103,700 |
| 2014 | $5,756 | $214,700 | $111,000 | $103,700 |
| 2013 | -- | $214,700 | $111,000 | $103,700 |
| 2012 | -- | $229,300 | $121,400 | $107,900 |
Source: Public Records
Map
Nearby Homes
- 122 South St
- 0 South St Unit 4969509
- 12 Avon St
- 105 S Main St
- 15 Wilson Ave
- 22 Wilson Ave
- 33 Spruce St
- 0 Spruce St Unit 88
- 24 Badger St
- 47 South St
- 14 Downing St
- 376 S Main St
- 14-16 Perley St
- 10 Perley St
- 289 South St
- 87 S Main St Unit 2
- 4 Fayette St
- 54 Pleasant St Unit 8
- 53 Heather Ln
- 22 Longmeadow Dr