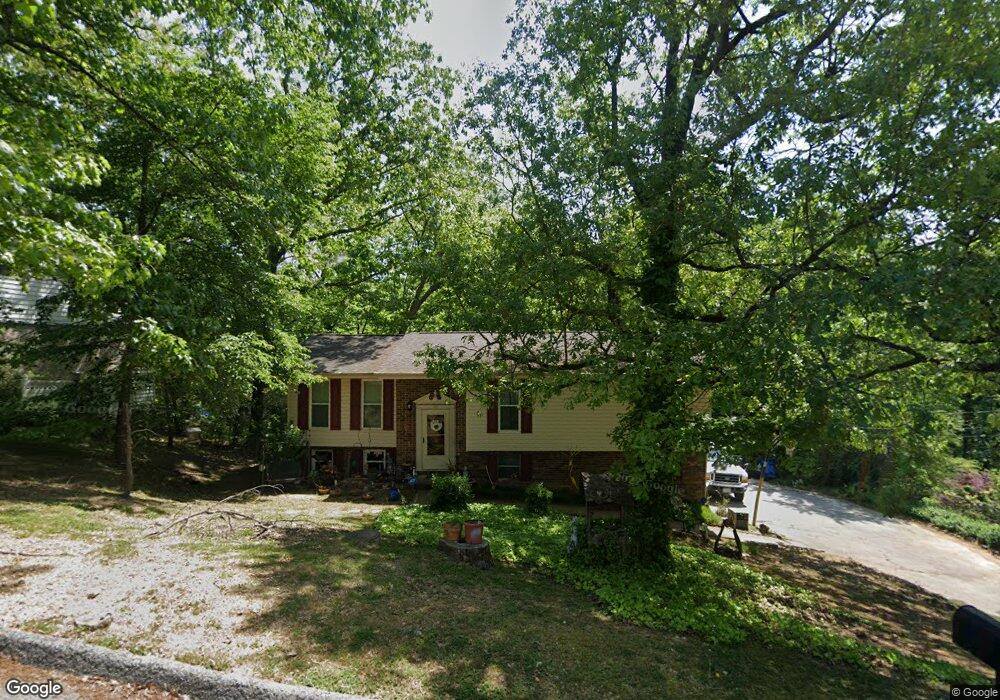
26 Glass Slipper Trail Flintstone, GA 30725
Flintstone NeighborhoodEstimated Value: $186,827 - $264,000
--
Bed
2
Baths
1,220
Sq Ft
$192/Sq Ft
Est. Value
About This Home
This home is located at 26 Glass Slipper Trail, Flintstone, GA 30725 and is currently estimated at $234,707, approximately $192 per square foot. 26 Glass Slipper Trail is a home located in Walker County with nearby schools including Chattanooga Valley Elementary School, Chattanooga Valley Middle School, and Ridgeland High School.
Ownership History
Date
Name
Owned For
Owner Type
Purchase Details
Closed on
Jul 17, 2003
Sold by
Hampton Kei Cannon
Bought by
Petersen Peter A and Petersen Kei H
Current Estimated Value
Purchase Details
Closed on
Sep 18, 1999
Sold by
Cal Developing Co
Bought by
Hampton Kei Cannon
Purchase Details
Closed on
Oct 6, 1993
Sold by
Umlauf Edward D and Umlauf Sandra
Bought by
Hampton Danny M and Hampton Kei C
Purchase Details
Closed on
Sep 9, 1991
Sold by
Harrison William C and Harrison Patricia
Bought by
Umlauf Edward D and Umlauf Sandra
Purchase Details
Closed on
Feb 1, 1978
Sold by
Shelabarger Donald E and Shelabarger Diane
Bought by
Harrison William C and Harrison Patricia
Purchase Details
Closed on
Feb 14, 1976
Sold by
Shell Lee R and Shell Hazel
Bought by
Shelabarger Donald E and Shelabarger Diane
Purchase Details
Closed on
Jun 12, 1975
Bought by
Shell Lee R and Shell Hazel
Create a Home Valuation Report for This Property
The Home Valuation Report is an in-depth analysis detailing your home's value as well as a comparison with similar homes in the area
Home Values in the Area
Average Home Value in this Area
Purchase History
| Date | Buyer | Sale Price | Title Company |
|---|---|---|---|
| Petersen Peter A | -- | -- | |
| Hampton Kei Cannon | -- | -- | |
| Hampton Danny M | $50,000 | -- | |
| Cal Developing Co | $15,000 | -- | |
| Umlauf Edward D | $49,900 | -- | |
| Harrison William C | -- | -- | |
| Shelabarger Donald E | -- | -- | |
| Shell Lee R | -- | -- |
Source: Public Records
Tax History Compared to Growth
Tax History
| Year | Tax Paid | Tax Assessment Tax Assessment Total Assessment is a certain percentage of the fair market value that is determined by local assessors to be the total taxable value of land and additions on the property. | Land | Improvement |
|---|---|---|---|---|
| 2024 | $1,609 | $70,824 | $6,091 | $64,733 |
| 2023 | $1,564 | $67,233 | $6,091 | $61,142 |
| 2022 | $1,406 | $55,260 | $3,384 | $51,876 |
| 2021 | $1,096 | $37,889 | $3,384 | $34,505 |
| 2020 | $975 | $31,948 | $3,384 | $28,564 |
| 2019 | $992 | $31,948 | $3,384 | $28,564 |
| 2018 | $845 | $31,948 | $3,384 | $28,564 |
| 2017 | $1,079 | $31,948 | $3,384 | $28,564 |
| 2016 | $912 | $31,948 | $3,384 | $28,564 |
| 2015 | $969 | $32,225 | $3,744 | $28,481 |
| 2014 | $878 | $32,225 | $3,744 | $28,481 |
| 2013 | -- | $32,224 | $3,744 | $28,480 |
Source: Public Records
Map
Nearby Homes
- 113 Fox Run Cir N
- 569 Tinker Bell Cir
- 184 Cinderella Dr
- 137 Fox Run Cir N
- 4302 Happy Valley Rd
- 76 Saddlebred Way
- 4766 Happy Valley Rd
- 114 Saddlebred Way
- 18 Buck Creek Ln
- 278 Dry Valley Rd
- 306 Dry Valley Rd
- 2937 Happy Valley Rd
- 880 Dry Valley Rd
- 297 Draft St
- 307 Draft St
- 313 Draft St
- 259 Draft St
- 346 Draft St
- 300 Draft St
- 334 Draft St
- 50 Glass Slipper Trail
- 72 Glass Slipper Trail
- 27 Glass Slipper Trail
- 1355 Glass Slipper Trail
- 49 Glass Slipper Trail
- 249 Cinderella Dr
- 71 Glass Slipper Tr
- 88 Glass Slipper Trail
- 71 Glass Slipper Trail
- 12 Fox Run Cir S
- 527 Tinker Bell Cir
- 71 Fox Run Cir S
- 43 Fox Run Cir N
- 507 Tinker Bell Cir
- 231 Cinderella Dr
- 242 Cinderella Dr
- 557 Tinker Bell Cir
- 75 Fox Run Cir N
- 98 Glass Slipper Trail
- 41 Fox Run Cir N