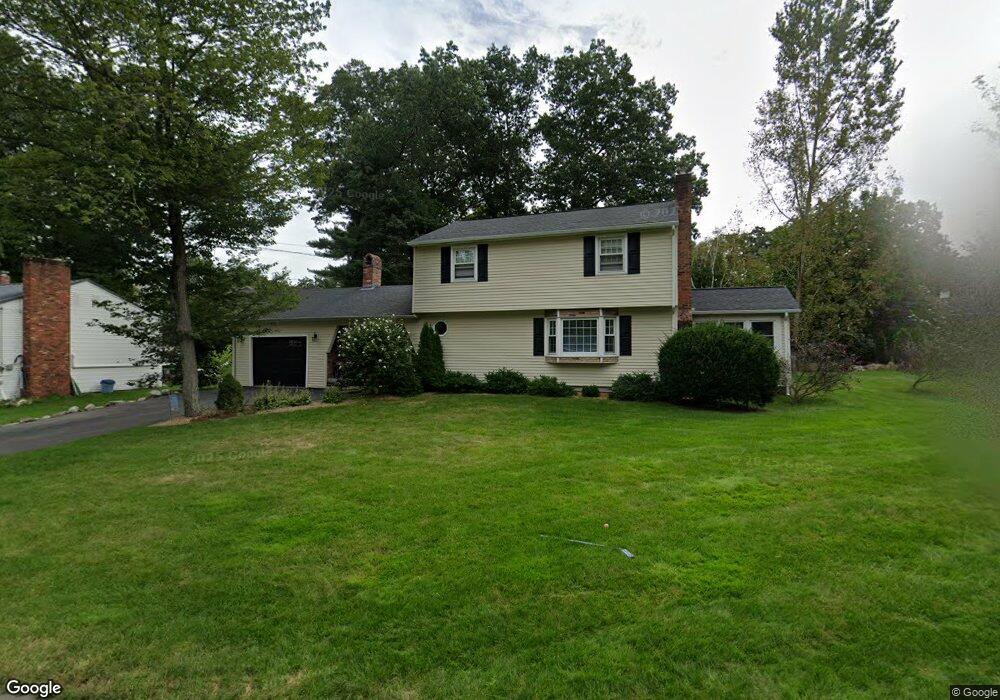
26 Glen Dr Nashua, NH 03062
Southwest Nashua NeighborhoodEstimated Value: $536,222 - $596,000
3
Beds
2
Baths
1,736
Sq Ft
$325/Sq Ft
Est. Value
About This Home
This home is located at 26 Glen Dr, Nashua, NH 03062 and is currently estimated at $564,306, approximately $325 per square foot. 26 Glen Dr is a home located in Hillsborough County with nearby schools including New Searles School, Fairgrounds Middle School, and Nashua High School South.
Ownership History
Date
Name
Owned For
Owner Type
Purchase Details
Closed on
May 29, 2009
Sold by
Mills Cleora P
Bought by
Hammond Jason M and Vergados Kristen E
Current Estimated Value
Home Financials for this Owner
Home Financials are based on the most recent Mortgage that was taken out on this home.
Original Mortgage
$237,535
Interest Rate
4.87%
Mortgage Type
Purchase Money Mortgage
Purchase Details
Closed on
Jul 31, 2000
Sold by
Pennington Richard L and Pennington Patrice A
Bought by
Copley Douglas H and Copley Susan H
Create a Home Valuation Report for This Property
The Home Valuation Report is an in-depth analysis detailing your home's value as well as a comparison with similar homes in the area
Home Values in the Area
Average Home Value in this Area
Purchase History
| Date | Buyer | Sale Price | Title Company |
|---|---|---|---|
| Hammond Jason M | $245,800 | -- | |
| Copley Douglas H | $140,000 | -- |
Source: Public Records
Mortgage History
| Date | Status | Borrower | Loan Amount |
|---|---|---|---|
| Open | Copley Douglas H | $232,561 | |
| Closed | Copley Douglas H | $237,535 |
Source: Public Records
Tax History Compared to Growth
Tax History
| Year | Tax Paid | Tax Assessment Tax Assessment Total Assessment is a certain percentage of the fair market value that is determined by local assessors to be the total taxable value of land and additions on the property. | Land | Improvement |
|---|---|---|---|---|
| 2024 | $7,696 | $484,000 | $160,400 | $323,600 |
| 2023 | $7,230 | $396,600 | $128,300 | $268,300 |
| 2022 | $7,167 | $396,600 | $128,300 | $268,300 |
| 2021 | $6,462 | $278,300 | $85,500 | $192,800 |
| 2020 | $6,292 | $278,300 | $85,500 | $192,800 |
| 2019 | $6,036 | $277,400 | $85,500 | $191,900 |
| 2018 | $5,884 | $277,400 | $85,500 | $191,900 |
| 2017 | $6,043 | $234,300 | $66,500 | $167,800 |
| 2016 | $5,874 | $234,300 | $66,500 | $167,800 |
| 2015 | $5,747 | $234,300 | $66,500 | $167,800 |
| 2014 | $5,635 | $234,300 | $66,500 | $167,800 |
Source: Public Records
Map
Nearby Homes
- 23 Glen Dr
- 2 Wakefield Dr
- 29 Greenwood Dr
- 4 Henry David Dr Unit 203
- 5 Wilderness Dr
- 57 Wethersfield Rd
- 15 Westray Dr
- 11 Bordeaux St
- 5 Appaloosa Place
- 375 Main Dunstable Rd
- 22 Kern Dr
- 31 Tenby Dr
- 247 Main Dunstable Rd
- 29 Dickens St
- 97 Linwood St
- 30 Gendron St
- 63 Dexter St
- 8 Althea Ln Unit U26
- 17 Herrick St
- 25 Cortez Dr Unit U57