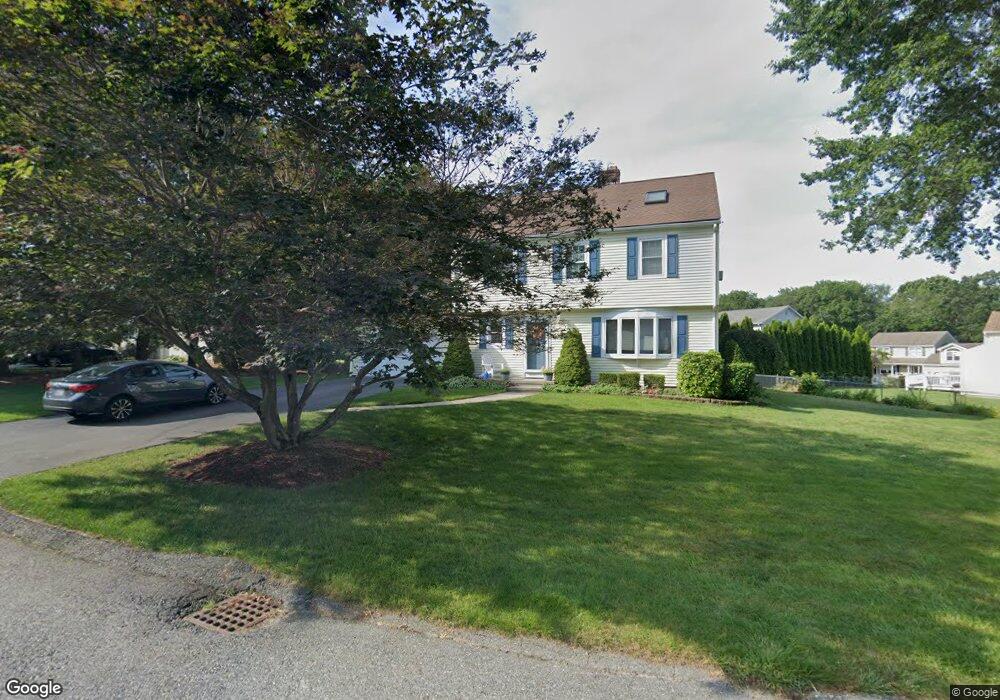
26 Greenview St Cumberland, RI 02864
Cumberland Hill NeighborhoodEstimated Value: $650,000 - $826,000
3
Beds
3
Baths
2,480
Sq Ft
$296/Sq Ft
Est. Value
About This Home
This home is located at 26 Greenview St, Cumberland, RI 02864 and is currently estimated at $734,047, approximately $295 per square foot. 26 Greenview St is a home located in Providence County with nearby schools including Ashton Elementary School, North Cumberland Middle School, and Cumberland High School.
Ownership History
Date
Name
Owned For
Owner Type
Purchase Details
Closed on
Jul 14, 2025
Sold by
Carlmark Richard T and Carlmark Johanna K
Bought by
Richard Tucker Carlmark T and Richard Carlmark
Current Estimated Value
Purchase Details
Closed on
Sep 4, 2001
Sold by
Cormier Jeanne R
Bought by
Carlmark Richard T and Carlmark Johanna K
Create a Home Valuation Report for This Property
The Home Valuation Report is an in-depth analysis detailing your home's value as well as a comparison with similar homes in the area
Home Values in the Area
Average Home Value in this Area
Purchase History
| Date | Buyer | Sale Price | Title Company |
|---|---|---|---|
| Richard Tucker Carlmark T | -- | -- | |
| Richard Tucker Carlmark T | -- | -- | |
| Carlmark Richard T | $285,000 | -- | |
| Carlmark Richard T | $285,000 | -- |
Source: Public Records
Mortgage History
| Date | Status | Borrower | Loan Amount |
|---|---|---|---|
| Previous Owner | Carlmark Richard T | $50,000 | |
| Previous Owner | Carlmark Richard T | $110,000 | |
| Previous Owner | Carlmark Richard T | $128,000 |
Source: Public Records
Tax History Compared to Growth
Tax History
| Year | Tax Paid | Tax Assessment Tax Assessment Total Assessment is a certain percentage of the fair market value that is determined by local assessors to be the total taxable value of land and additions on the property. | Land | Improvement |
|---|---|---|---|---|
| 2025 | $6,913 | $563,400 | $191,900 | $371,500 |
| 2024 | $6,733 | $563,400 | $191,900 | $371,500 |
| 2023 | $6,547 | $563,400 | $191,900 | $371,500 |
| 2022 | $6,179 | $412,200 | $138,300 | $273,900 |
| 2021 | $6,076 | $412,200 | $138,300 | $273,900 |
| 2020 | $5,903 | $412,200 | $138,300 | $273,900 |
| 2019 | $6,009 | $378,400 | $127,100 | $251,300 |
| 2018 | $5,835 | $378,400 | $127,100 | $251,300 |
| 2017 | $5,755 | $378,400 | $127,100 | $251,300 |
| 2016 | $5,867 | $343,500 | $120,100 | $223,400 |
| 2015 | $5,867 | $343,500 | $120,100 | $223,400 |
| 2014 | $5,867 | $343,500 | $120,100 | $223,400 |
| 2013 | $5,255 | $333,000 | $122,200 | $210,800 |
Source: Public Records
Map
Nearby Homes
- 33 Sandy Way
- 2970 Mendon Rd Unit 84
- 2970 Mendon Rd Unit 154
- 2894 Mendon Rd
- 12 Dulles St
- 15 New Clark Rd
- 96 Evergreen St
- 11 Secluded Ct
- 45 Rose Ln
- 200 Heroux Blvd Unit 606
- 11 Southbury Rd
- 106 Canning St
- 41 Mount Pleasant View Ave
- 2 Angle St Unit 5
- 50 Circledale Dr
- 25 Manville Hill Rd
- 125 Main St
- 200 Manville Hill Rd Unit 64
- 2 Main St Unit 15
- 2 School St Unit 403