26 Grove Ave Shelby, OH 44875
Estimated Value: $90,000 - $142,000
2
Beds
1
Bath
955
Sq Ft
$128/Sq Ft
Est. Value
About This Home
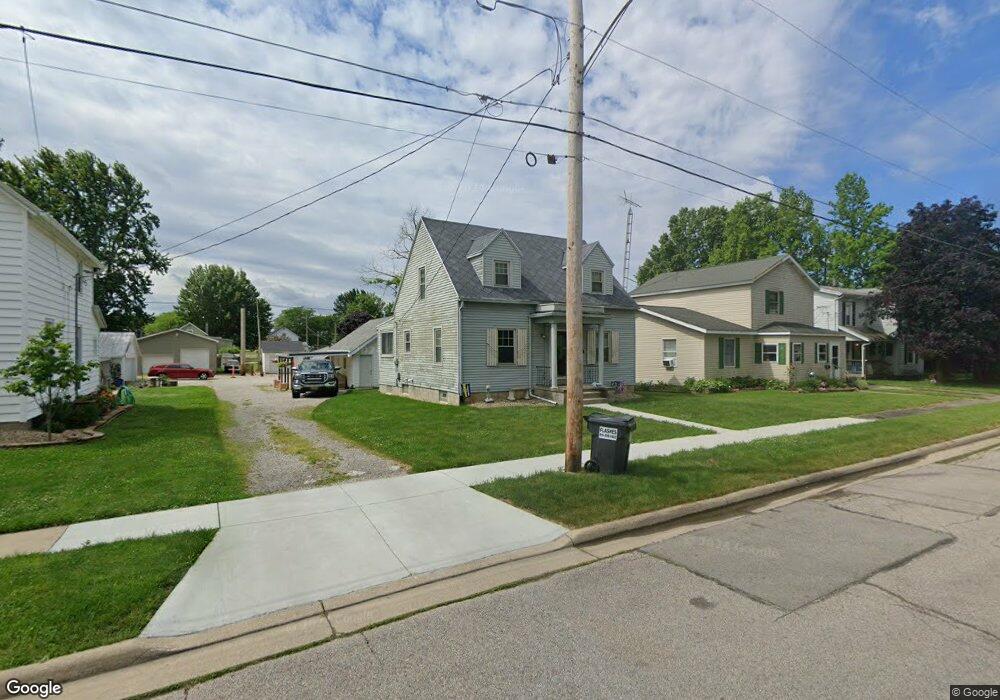
This home is located at 26 Grove Ave, Shelby, OH 44875 and is currently estimated at $122,489, approximately $128 per square foot. 26 Grove Ave is a home located in Richland County with nearby schools including St. Mary's School.
Ownership History
Date
Name
Owned For
Owner Type
Purchase Details
Closed on
Apr 3, 2006
Sold by
Swank Sue J
Bought by
Ritchey John E and Ritchey Michelle R
Current Estimated Value
Home Financials for this Owner
Home Financials are based on the most recent Mortgage that was taken out on this home.
Original Mortgage
$76,500
Outstanding Balance
$43,911
Interest Rate
6.34%
Mortgage Type
Fannie Mae Freddie Mac
Estimated Equity
$78,578
Purchase Details
Closed on
Jun 17, 1999
Sold by
Miller Ardon R
Bought by
Swank Sue J
Create a Home Valuation Report for This Property
The Home Valuation Report is an in-depth analysis detailing your home's value as well as a comparison with similar homes in the area
Home Values in the Area
Average Home Value in this Area
Purchase History
| Date | Buyer | Sale Price | Title Company |
|---|---|---|---|
| Ritchey John E | $76,500 | Southern Title | |
| Swank Sue J | $64,000 | -- |
Source: Public Records
Mortgage History
| Date | Status | Borrower | Loan Amount |
|---|---|---|---|
| Open | Ritchey John E | $76,500 |
Source: Public Records
Tax History Compared to Growth
Tax History
| Year | Tax Paid | Tax Assessment Tax Assessment Total Assessment is a certain percentage of the fair market value that is determined by local assessors to be the total taxable value of land and additions on the property. | Land | Improvement |
|---|---|---|---|---|
| 2024 | $871 | $22,790 | $4,900 | $17,890 |
| 2023 | $871 | $22,790 | $4,900 | $17,890 |
| 2022 | $601 | $14,070 | $4,960 | $9,110 |
| 2021 | $602 | $14,070 | $4,960 | $9,110 |
| 2020 | $602 | $14,070 | $4,960 | $9,110 |
| 2019 | $564 | $12,100 | $4,200 | $7,900 |
| 2018 | $559 | $12,100 | $4,200 | $7,900 |
| 2017 | $541 | $12,100 | $4,200 | $7,900 |
| 2016 | $529 | $11,630 | $3,990 | $7,640 |
| 2015 | $526 | $11,630 | $3,990 | $7,640 |
| 2014 | $508 | $11,630 | $3,990 | $7,640 |
| 2012 | $263 | $12,240 | $4,200 | $8,040 |
Source: Public Records
Map
Nearby Homes