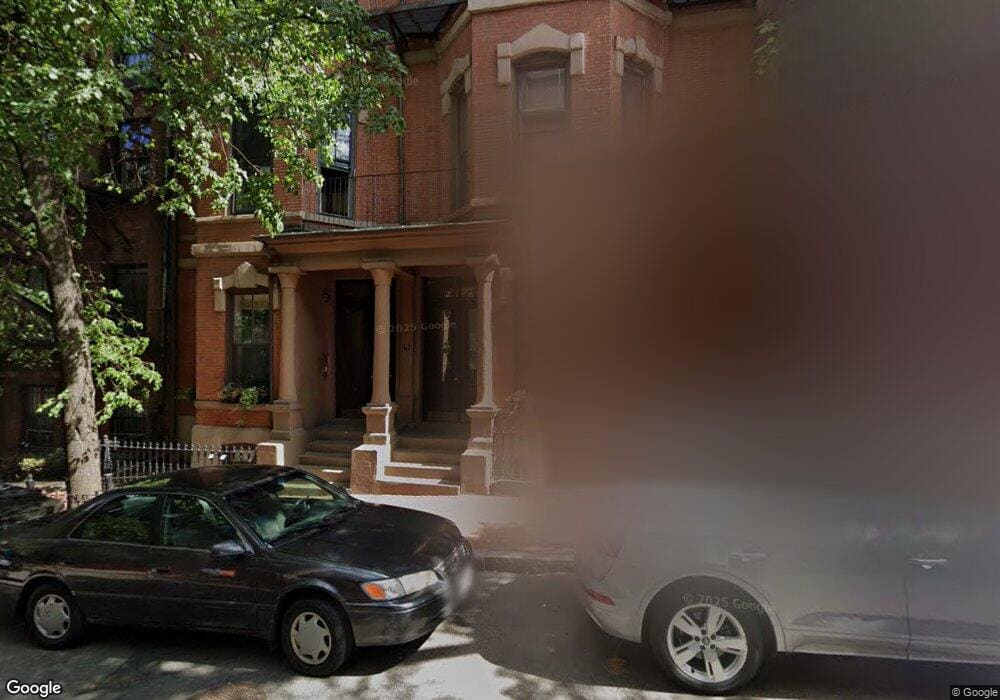
26 Hancock St Unit 4 Boston, MA 02114
Beacon Hill NeighborhoodEstimated Value: $1,041,000 - $1,177,000
2
Beds
1
Bath
923
Sq Ft
$1,181/Sq Ft
Est. Value
About This Home
This home is located at 26 Hancock St Unit 4, Boston, MA 02114 and is currently estimated at $1,089,908, approximately $1,180 per square foot. 26 Hancock St Unit 4 is a home located in Suffolk County with nearby schools including Torit Montessori School, Boston Children's School, and Advent School.
Ownership History
Date
Name
Owned For
Owner Type
Purchase Details
Closed on
Feb 13, 2023
Sold by
Marilyn M Hartke 2019 Ret
Bought by
Neff Thomas M and Haviland Mary L
Current Estimated Value
Purchase Details
Closed on
May 9, 2019
Sold by
Hartke Jerome L
Bought by
Jerome L Hartke 2019 Ret
Create a Home Valuation Report for This Property
The Home Valuation Report is an in-depth analysis detailing your home's value as well as a comparison with similar homes in the area
Home Values in the Area
Average Home Value in this Area
Purchase History
| Date | Buyer | Sale Price | Title Company |
|---|---|---|---|
| Neff Thomas M | $910,000 | None Available | |
| Jerome L Hartke 2019 Ret | -- | -- | |
| Marilyn M Hartke 2019 Ret | -- | -- | |
| Hartke Marilyn M | -- | -- |
Source: Public Records
Tax History Compared to Growth
Tax History
| Year | Tax Paid | Tax Assessment Tax Assessment Total Assessment is a certain percentage of the fair market value that is determined by local assessors to be the total taxable value of land and additions on the property. | Land | Improvement |
|---|---|---|---|---|
| 2025 | $10,974 | $947,700 | $0 | $947,700 |
| 2024 | $9,221 | $846,000 | $0 | $846,000 |
| 2023 | $9,086 | $846,000 | $0 | $846,000 |
| 2022 | $9,027 | $829,700 | $0 | $829,700 |
| 2021 | $8,867 | $831,000 | $0 | $831,000 |
| 2020 | $8,327 | $788,500 | $0 | $788,500 |
| 2019 | $7,841 | $743,900 | $0 | $743,900 |
| 2018 | $7,352 | $701,500 | $0 | $701,500 |
| 2017 | $6,889 | $650,500 | $0 | $650,500 |
| 2016 | $7,852 | $713,800 | $0 | $713,800 |
| 2015 | $7,182 | $593,100 | $0 | $593,100 |
| 2014 | $6,974 | $554,400 | $0 | $554,400 |
Source: Public Records
Map
Nearby Homes
- 45 Temple St Unit 306
- 45 Temple St Unit 408
- 45 Temple St Unit 405
- 45 Temple St Unit 502
- 45 Temple St Unit 410
- 45 Temple St Unit 202
- 34 Hancock St Unit 2B
- 34 Hancock St Unit 1D
- 40 Temple St
- 32 Derne St Unit 3A
- 32 Derne St Unit 2A
- 34 Temple St
- 34 Temple St Unit 34
- 32 Temple St Unit 3
- 57 Hancock St
- 15 Hancock St Unit 1
- 33 Bowdoin St Unit 1
- 33 Bowdoin St Unit PH
- 27 Bowdoin St Unit 1C
- 27 Bowdoin St Unit 5
- 26 Hancock St Unit 7
- 26 Hancock St Unit 6
- 26 Hancock St Unit 5
- 26 Hancock St Unit 3
- 26 Hancock St Unit 2
- 26 Hancock St Unit 1
- 28 Hancock St Unit 4
- 28 Hancock St Unit 2
- 28 Hancock St Unit 1
- 28 Hancock St Unit 3
- 28 Hancock St Unit 4,28
- 26 Hancock St
- 28 Hancock St
- 30 Hancock St Unit 5
- 30 Hancock St Unit 4
- 30 Hancock St Unit 3
- 30 Hancock St Unit 2
- 30 Hancock St Unit 1
- 30 Hancock St Unit M
- 30 Hancock St Unit 9A