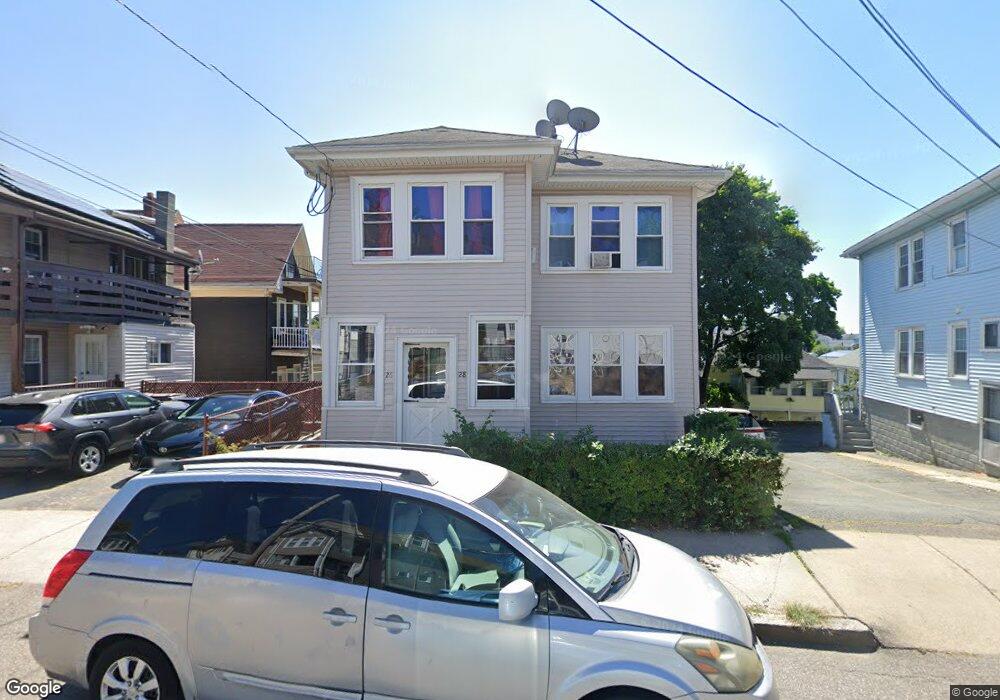
26 Harding Ave Unit 2 Everett, MA 02149
Glendale NeighborhoodEstimated Value: $734,630 - $856,000
3
Beds
1
Bath
1,000
Sq Ft
$792/Sq Ft
Est. Value
About This Home
This home is located at 26 Harding Ave Unit 2, Everett, MA 02149 and is currently estimated at $792,158, approximately $792 per square foot. 26 Harding Ave Unit 2 is a home located in Middlesex County with nearby schools including Everett High School and Pioneer Charter School of Science.
Ownership History
Date
Name
Owned For
Owner Type
Purchase Details
Closed on
Aug 7, 2015
Sold by
Quad Real Estate Llc
Bought by
Thapa Dipendra and Thapa Dhana K
Current Estimated Value
Home Financials for this Owner
Home Financials are based on the most recent Mortgage that was taken out on this home.
Original Mortgage
$377,492
Outstanding Balance
$291,438
Interest Rate
3.5%
Mortgage Type
FHA
Estimated Equity
$500,720
Purchase Details
Closed on
Aug 5, 2009
Sold by
Tano James J
Bought by
Quad Re Llc
Purchase Details
Closed on
Jan 22, 1999
Sold by
Oneil Richard J and Tano James
Bought by
Tano James
Home Financials for this Owner
Home Financials are based on the most recent Mortgage that was taken out on this home.
Original Mortgage
$106,400
Interest Rate
6.7%
Mortgage Type
Purchase Money Mortgage
Create a Home Valuation Report for This Property
The Home Valuation Report is an in-depth analysis detailing your home's value as well as a comparison with similar homes in the area
Home Values in the Area
Average Home Value in this Area
Purchase History
| Date | Buyer | Sale Price | Title Company |
|---|---|---|---|
| Thapa Dipendra | $450,000 | -- | |
| Quad Re Llc | $286,000 | -- | |
| Quad Re Llc | $286,000 | -- | |
| Tano James | $133,000 | -- |
Source: Public Records
Mortgage History
| Date | Status | Borrower | Loan Amount |
|---|---|---|---|
| Open | Thapa Dipendra | $377,492 | |
| Closed | Tano James | $377,492 | |
| Previous Owner | Tano James | $106,400 |
Source: Public Records
Tax History
| Year | Tax Paid | Tax Assessment Tax Assessment Total Assessment is a certain percentage of the fair market value that is determined by local assessors to be the total taxable value of land and additions on the property. | Land | Improvement |
|---|---|---|---|---|
| 2025 | $8,222 | $721,900 | $236,300 | $485,600 |
| 2024 | $7,593 | $662,600 | $215,200 | $447,400 |
| 2023 | $7,413 | $629,300 | $205,900 | $423,400 |
| 2022 | $5,951 | $574,400 | $182,500 | $391,900 |
| 2021 | $5,459 | $553,100 | $175,900 | $377,200 |
| 2020 | $5,747 | $540,100 | $175,900 | $364,200 |
| 2019 | $6,070 | $490,300 | $167,500 | $322,800 |
| 2018 | $5,950 | $431,800 | $146,000 | $285,800 |
| 2017 | $5,679 | $393,300 | $131,000 | $262,300 |
| 2016 | $5,088 | $352,100 | $117,000 | $235,100 |
| 2015 | $4,741 | $324,500 | $105,500 | $219,000 |
Source: Public Records
Map
Nearby Homes
- 30 Clarence St
- 211 Elm St
- 53 Sycamore St
- 260 Elm St
- 55 Garland St
- 40 Glendale Ave
- 30 Woodlawn St
- 859 Broadway Unit 15
- 101 Springvale Ave
- 881 Broadway Unit 28
- 138 Fremont Ave
- 15 Waverly Ave
- 114 Francis St
- 110 Ferry St
- 5 Mason St
- 12 Hamilton St Unit 8
- 450 Vane St
- 581 & 233 Proctor & Washington Ave
- 1 Elwood St
- 44 Walnut St
Your Personal Tour Guide
Ask me questions while you tour the home.