
Seller's Agent in 2025
The Acuna Group
(413) 626-4097
9 in this area
139 Total Sales


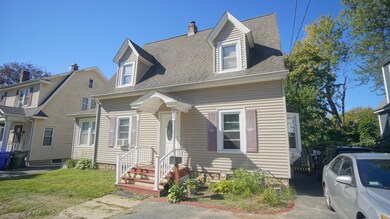


Exciting opportunity to own a home with classic charm! A generous living room with fireplace, a formal dining room with large bay window, a sunny bonus room and a cozy breakfast nook in the kitchen. Lots of hardwood floors! 3 bedrooms and a walkup attic for additional storage. This property presents a canvas for creating a personalized living space and offers versatility and comfort for everyday living.
| Date | Type | Sale Price | Title Company |
|---|---|---|---|
| Warranty Deed | $255,000 | -- | |
| Deed | $95,000 | -- | |
| Deed | $149,900 | -- | |
| Deed | $107,000 | -- |
| Date | Status | Loan Amount | Loan Type |
|---|---|---|---|
| Open | $219,300 | New Conventional | |
| Previous Owner | $21,200 | No Value Available | |
| Previous Owner | $89,890 | Purchase Money Mortgage | |
| Previous Owner | $3,000 | No Value Available | |
| Previous Owner | $119,920 | Purchase Money Mortgage |
| Date | Event | Price | List to Sale | Price per Sq Ft |
|---|---|---|---|---|
| 12/15/2025 12/15/25 | Sold | $255,000 | +6.3% | $184 / Sq Ft |
| 10/17/2025 10/17/25 | Pending | -- | -- | -- |
| 10/08/2025 10/08/25 | For Sale | $240,000 | -- | $173 / Sq Ft |
| Year | Tax Paid | Tax Assessment Tax Assessment Total Assessment is a certain percentage of the fair market value that is determined by local assessors to be the total taxable value of land and additions on the property. | Land | Improvement |
|---|---|---|---|---|
| 2025 | $3,920 | $250,000 | $45,800 | $204,200 |
| 2024 | $3,374 | $210,100 | $45,800 | $164,300 |
| 2023 | $3,485 | $204,400 | $43,600 | $160,800 |
| 2022 | $3,544 | $188,300 | $43,600 | $144,700 |
| 2021 | $3,300 | $174,600 | $39,600 | $135,000 |
| 2020 | $3,179 | $162,800 | $39,600 | $123,200 |
| 2019 | $2,976 | $151,200 | $39,600 | $111,600 |
| 2018 | $3,106 | $157,800 | $39,600 | $118,200 |
| 2017 | $3,018 | $153,500 | $39,600 | $113,900 |
| 2016 | $2,794 | $142,100 | $39,600 | $102,500 |
| 2015 | $2,805 | $142,600 | $39,600 | $103,000 |
Seller's Agent in 2025
The Acuna Group
(413) 626-4097
9 in this area
139 Total Sales
Seller Co-Listing Agent in 2025
Elias Acuna
(413) 626-4097
3 in this area
18 Total Sales
T
Buyer's Agent in 2025
Team ROVI
Real Broker MA, LLC
(413) 563-7913
9 in this area
378 Total Sales
Source: MLS Property Information Network (MLS PIN)
MLS Number: 73441297
APN: SPRI-006310-000000-000005
Disclaimer: Certain information contained herein is derived from information provided by parties other than Homes.com. All information provided is deemed reliable, but is not guaranteed to be accurate and should be independently verified.
![]() The property listing data and information, or the Images, set forth herein were provided to MLS Property Information Network, Inc. from third party sources, including sellers, lessors and public records, and were compiled by MLS Property Information Network, Inc. The property listing data and information, and the Images, are for the personal, non-commercial use of consumers having a good faith interest in purchasing or leasing listed properties of the type displayed to them and may not be used for any purpose other than to identify prospective properties which such consumers may have a good faith interest in purchasing or leasing. MLS Property Information Network, Inc. and its subscribers disclaim any and all representations and warranties as to the accuracy of the property listing data and information, or as to the accuracy of any of the Images, set forth herein.
The property listing data and information, or the Images, set forth herein were provided to MLS Property Information Network, Inc. from third party sources, including sellers, lessors and public records, and were compiled by MLS Property Information Network, Inc. The property listing data and information, and the Images, are for the personal, non-commercial use of consumers having a good faith interest in purchasing or leasing listed properties of the type displayed to them and may not be used for any purpose other than to identify prospective properties which such consumers may have a good faith interest in purchasing or leasing. MLS Property Information Network, Inc. and its subscribers disclaim any and all representations and warranties as to the accuracy of the property listing data and information, or as to the accuracy of any of the Images, set forth herein.
Ask me questions while you tour the home.