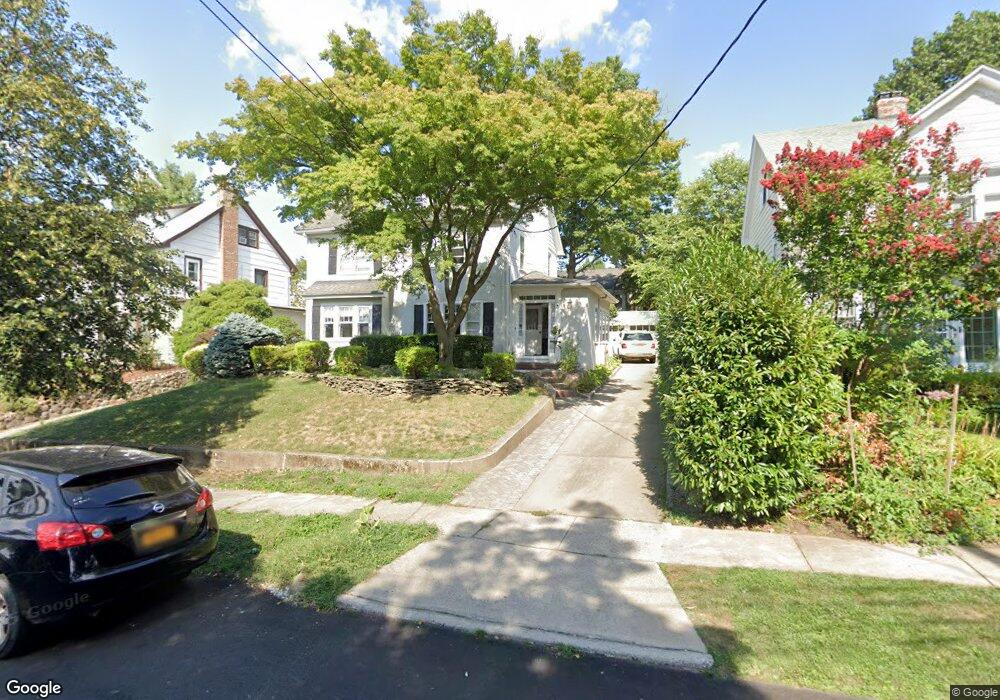
26 Hillcrest Ave Unit Building Little Neck, NY 11363
Douglas Manor NeighborhoodEstimated Value: $1,164,000 - $1,398,000
--
Bed
3
Baths
2,595
Sq Ft
$491/Sq Ft
Est. Value
About This Home
This home is located at 26 Hillcrest Ave Unit Building, Little Neck, NY 11363 and is currently estimated at $1,273,384, approximately $490 per square foot. 26 Hillcrest Ave Unit Building is a home located in Queens County with nearby schools including P.S. 098 The Douglaston School, Louis Pasteur Middle School 67, and Benjamin N Cardozo High School.
Ownership History
Date
Name
Owned For
Owner Type
Purchase Details
Closed on
Oct 22, 2021
Sold by
Dulberg Marybeth and Dulberg Matthew S
Bought by
Mizan Iftakhar and Parveen Roksana
Current Estimated Value
Home Financials for this Owner
Home Financials are based on the most recent Mortgage that was taken out on this home.
Original Mortgage
$729,375
Outstanding Balance
$667,883
Interest Rate
3.09%
Mortgage Type
Purchase Money Mortgage
Estimated Equity
$605,501
Purchase Details
Closed on
Feb 12, 1997
Sold by
Larocco Louis R and Larocco Eleanore M
Bought by
Dulberg Matthew S and Dulberg Marybeth
Home Financials for this Owner
Home Financials are based on the most recent Mortgage that was taken out on this home.
Original Mortgage
$369,600
Interest Rate
7.25%
Create a Home Valuation Report for This Property
The Home Valuation Report is an in-depth analysis detailing your home's value as well as a comparison with similar homes in the area
Home Values in the Area
Average Home Value in this Area
Purchase History
| Date | Buyer | Sale Price | Title Company |
|---|---|---|---|
| Mizan Iftakhar | $972,500 | -- | |
| Dulberg Matthew S | $462,000 | Commonwealth Land Title Ins |
Source: Public Records
Mortgage History
| Date | Status | Borrower | Loan Amount |
|---|---|---|---|
| Open | Mizan Iftakhar | $729,375 | |
| Previous Owner | Dulberg Matthew S | $369,600 |
Source: Public Records
Tax History Compared to Growth
Tax History
| Year | Tax Paid | Tax Assessment Tax Assessment Total Assessment is a certain percentage of the fair market value that is determined by local assessors to be the total taxable value of land and additions on the property. | Land | Improvement |
|---|---|---|---|---|
| 2025 | $12,955 | $68,358 | $18,771 | $49,587 |
| 2024 | $12,955 | $64,502 | $19,751 | $44,751 |
| 2023 | $12,955 | $64,502 | $17,963 | $46,539 |
| 2022 | $12,237 | $89,100 | $23,627 | $65,473 |
| 2021 | $11,954 | $84,167 | $23,627 | $60,540 |
| 2020 | $11,835 | $82,260 | $23,280 | $58,980 |
| 2019 | $10,952 | $90,600 | $23,280 | $67,320 |
| 2018 | $10,660 | $53,752 | $19,620 | $34,132 |
| 2017 | $10,114 | $51,083 | $16,476 | $34,607 |
| 2016 | $9,330 | $51,083 | $16,476 | $34,607 |
| 2015 | $5,569 | $47,299 | $17,394 | $29,905 |
| 2014 | $5,569 | $44,622 | $16,900 | $27,722 |
Source: Public Records
Map
Nearby Homes
- 26 Cherry St
- 38-47 Douglaston Pkwy
- 38-30 Douglaston Pkwy Unit G2
- 38-30 Douglaston Pkwy Unit H4
- 28 W 38th St Unit 2
- 28 W 38th St Unit 6E
- 101 Forest Rd
- 20 Ridge Rd
- 329 Forest Rd
- 23338 38th Dr
- 233-12 Bay St
- 301 Park Ln
- 39-04 Stuart Ln
- 233-17 38th Dr
- 24038 Poplar St
- 233-25 38th Dr
- 42-30 Douglaston Pkwy Unit 2P
- 42-30 Douglaston Pkwy Unit 3-L
- 41-27 Orient Ave
- 37-20 Brookside St
- 26 Hillcrest Ave
- 38 Hillcrest Ave
- 18 Hillcrest Ave
- 32 Hillcrest Ave
- 240-34 38th Dr
- 240-08 38th Dr
- 127 Prospect Ave
- 240-21 38th Dr
- 240-15 38th Dr
- 121 Prospect Ave
- 8 Hillcrest Ave
- 139 Prospect Ave
- 18-07 38th Rd
- 3850 Hillcrest Ave
- 115 Prospect Ave
- 23634 38th Rd
- 3 Hillcrest Ave
- 9 Hillcrest Ave
- 2 Hillcrest Ave
- 109 Prospect Ave