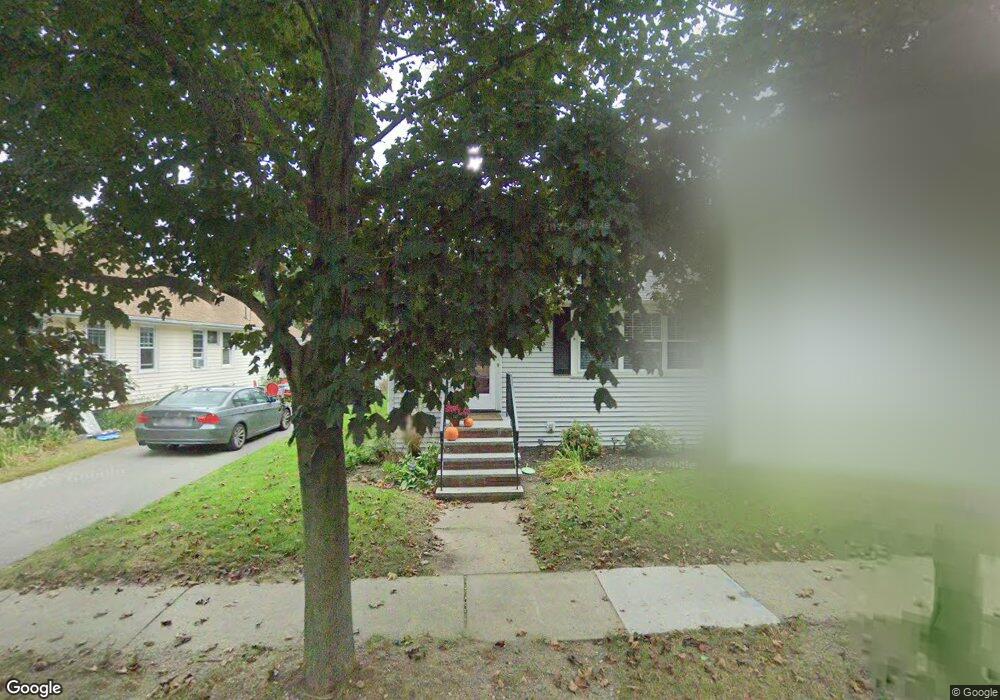
26 Hobomack Rd Quincy, MA 02169
Merrymount NeighborhoodEstimated Value: $611,000 - $738,000
2
Beds
1
Bath
1,328
Sq Ft
$493/Sq Ft
Est. Value
About This Home
This home is located at 26 Hobomack Rd, Quincy, MA 02169 and is currently estimated at $655,009, approximately $493 per square foot. 26 Hobomack Rd is a home located in Norfolk County with nearby schools including Merrymount Elementary School, Broad Meadows Middle School, and Quincy High School.
Ownership History
Date
Name
Owned For
Owner Type
Purchase Details
Closed on
Jun 30, 2000
Sold by
Carey Margaret M
Bought by
Whalen Michele M
Current Estimated Value
Home Financials for this Owner
Home Financials are based on the most recent Mortgage that was taken out on this home.
Original Mortgage
$135,000
Interest Rate
8.59%
Mortgage Type
Purchase Money Mortgage
Create a Home Valuation Report for This Property
The Home Valuation Report is an in-depth analysis detailing your home's value as well as a comparison with similar homes in the area
Home Values in the Area
Average Home Value in this Area
Purchase History
| Date | Buyer | Sale Price | Title Company |
|---|---|---|---|
| Whalen Michele M | $193,000 | -- |
Source: Public Records
Mortgage History
| Date | Status | Borrower | Loan Amount |
|---|---|---|---|
| Open | Whalen Michele M | $132,000 | |
| Closed | Whalen Michele M | $135,000 | |
| Closed | Whalen Michele M | $135,000 | |
| Previous Owner | Whalen Michele M | $50,000 |
Source: Public Records
Tax History Compared to Growth
Tax History
| Year | Tax Paid | Tax Assessment Tax Assessment Total Assessment is a certain percentage of the fair market value that is determined by local assessors to be the total taxable value of land and additions on the property. | Land | Improvement |
|---|---|---|---|---|
| 2025 | $6,850 | $594,100 | $339,600 | $254,500 |
| 2024 | $6,728 | $597,000 | $329,600 | $267,400 |
| 2023 | $6,196 | $556,700 | $286,600 | $270,100 |
| 2022 | $6,051 | $505,100 | $238,900 | $266,200 |
| 2021 | $5,945 | $489,700 | $238,900 | $250,800 |
| 2020 | $5,693 | $458,000 | $229,700 | $228,300 |
| 2019 | $5,379 | $428,600 | $214,700 | $213,900 |
| 2018 | $5,017 | $376,100 | $178,200 | $197,900 |
| 2017 | $5,127 | $361,800 | $186,700 | $175,100 |
| 2016 | $4,996 | $347,900 | $183,300 | $164,600 |
| 2015 | $4,688 | $321,100 | $172,900 | $148,200 |
| 2014 | $4,459 | $300,100 | $167,800 | $132,300 |
Source: Public Records
Map
Nearby Homes
- 37 Hobomack Rd
- 188 Samoset Ave
- 73 Albatross Rd
- 1421 Quincy Shore Dr
- 1427 Quincy Shore Dr
- 105 Sea St Unit 301
- 105 Sea St Unit 203
- 105 Sea St Unit 105
- 503 Sea St
- 599 Sea St
- 599 Sea St Unit 1
- 74 Butler Rd
- 20 Putnam St
- 100 Thornton St
- 12 Quentin St
- 200 Cove Way Unit 614
- 66 Mcgrath Hwy Unit 407
- 66 Mcgrath Hwy Unit 405
- 66 Mcgrath Hwy Unit 308
- 66 Mcgrath Hwy Unit 303
- 22 Hobomack Rd
- 30 Hobomack Rd
- 36 Hobomack Rd
- 34 Hobomack Rd
- 25 Algonquin Rd
- 23 Algonquin Rd
- 16 Hobomack Rd
- 17 Algonquin Rd
- 25 Hobomack Rd
- 38 Hobomack Rd
- 29 Hobomack Rd
- 29 Algonquin Rd
- 19 Hobomack Rd
- 21 Hobomack Rd
- 33 Hobomack Rd
- 33 Algonquin Rd
- 10 Hobomack Rd
- 9 Algonquin Rd
- 42 Hobomack Rd
- 15 Hobomack Rd