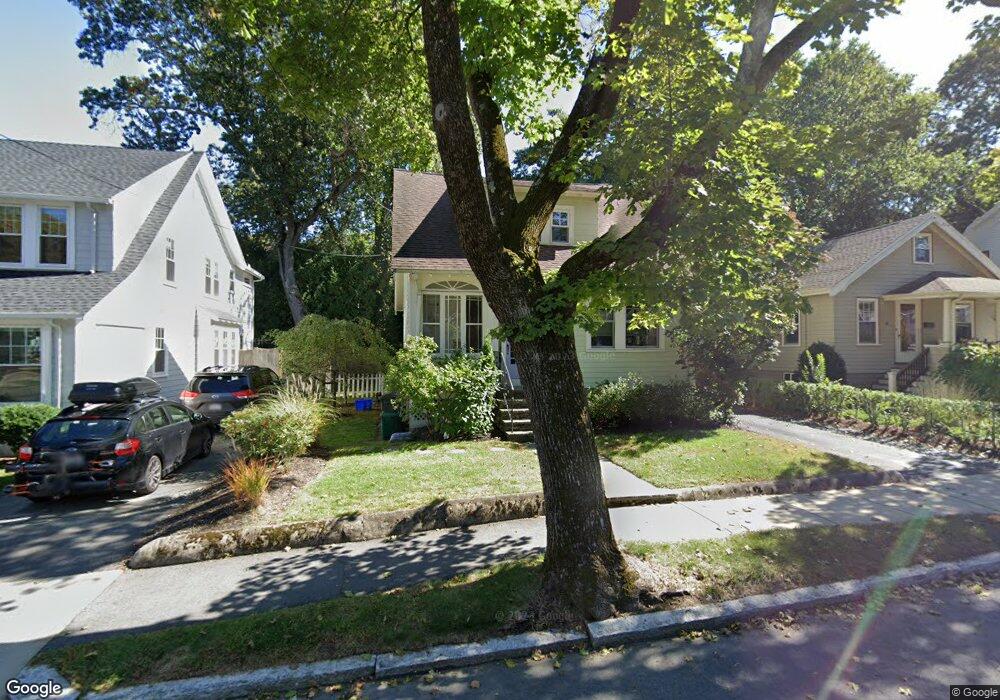
26 Inverness Rd Arlington, MA 02476
Arlington Heights NeighborhoodEstimated Value: $794,000 - $970,498
3
Beds
2
Baths
1,392
Sq Ft
$640/Sq Ft
Est. Value
About This Home
This home is located at 26 Inverness Rd, Arlington, MA 02476 and is currently estimated at $891,125, approximately $640 per square foot. 26 Inverness Rd is a home located in Middlesex County with nearby schools including Dallin Elementary School, Ottoson Middle School, and Arlington High School.
Ownership History
Date
Name
Owned For
Owner Type
Purchase Details
Closed on
Nov 15, 2022
Sold by
Colman Jeffrey W and Kramer-Colman Jill
Bought by
Jill K Colman Ret
Current Estimated Value
Purchase Details
Closed on
Jan 29, 1999
Sold by
Finer Jonathan R and Finer Linda O
Bought by
Colman Jeffrey W and Colman Jill K
Home Financials for this Owner
Home Financials are based on the most recent Mortgage that was taken out on this home.
Original Mortgage
$200,000
Interest Rate
6.67%
Mortgage Type
Purchase Money Mortgage
Purchase Details
Closed on
Nov 23, 1993
Sold by
Walsh Eleanor K Est
Bought by
Finer Jonathan R and Finer Linda O
Home Financials for this Owner
Home Financials are based on the most recent Mortgage that was taken out on this home.
Original Mortgage
$141,075
Interest Rate
6.77%
Mortgage Type
Purchase Money Mortgage
Create a Home Valuation Report for This Property
The Home Valuation Report is an in-depth analysis detailing your home's value as well as a comparison with similar homes in the area
Home Values in the Area
Average Home Value in this Area
Purchase History
| Date | Buyer | Sale Price | Title Company |
|---|---|---|---|
| Jill K Colman Ret | -- | None Available | |
| Colman Jeffrey W | $250,000 | -- | |
| Finer Jonathan R | $148,500 | -- |
Source: Public Records
Mortgage History
| Date | Status | Borrower | Loan Amount |
|---|---|---|---|
| Previous Owner | Finer Jonathan R | $162,500 | |
| Previous Owner | Finer Jonathan R | $200,000 | |
| Previous Owner | Finer Jonathan R | $141,075 |
Source: Public Records
Tax History Compared to Growth
Tax History
| Year | Tax Paid | Tax Assessment Tax Assessment Total Assessment is a certain percentage of the fair market value that is determined by local assessors to be the total taxable value of land and additions on the property. | Land | Improvement |
|---|---|---|---|---|
| 2025 | $8,402 | $780,100 | $433,200 | $346,900 |
| 2024 | $7,756 | $732,400 | $417,000 | $315,400 |
| 2023 | $7,758 | $692,100 | $389,900 | $302,200 |
| 2022 | $7,453 | $652,600 | $379,100 | $273,500 |
| 2021 | $7,310 | $644,600 | $379,100 | $265,500 |
| 2020 | $7,130 | $644,700 | $379,100 | $265,600 |
| 2019 | $6,679 | $593,200 | $373,600 | $219,600 |
| 2018 | $6,145 | $506,600 | $287,000 | $219,600 |
| 2017 | $6,159 | $490,400 | $270,800 | $219,600 |
| 2016 | $5,999 | $468,700 | $249,100 | $219,600 |
| 2015 | $5,966 | $440,300 | $232,800 | $207,500 |
Source: Public Records
Map
Nearby Homes
- 19 Wilbur Ave
- 56 Valentine Rd
- 107 Hibbert St
- 10 Colonial Village Dr Unit 2
- 64 Browning Rd
- 58 Westminster Ave Unit 58
- 14 Park Avenue Extension
- 181 Lowell St
- 51 Lowell St
- 1 Watermill Place Unit 308
- 11 Lowell St Unit B
- 70 Birch Hill Rd
- 37 Fountain Rd Unit 2
- 37 Fountain Rd
- 1205 Massachusetts Ave
- 6 Appleton Place
- 14 Burton St Unit 16
- 4 Beck Rd
- 475 Massachusetts Ave Unit B
- 15 Higgins St Unit 17
- 22 Inverness Rd
- 18 Inverness Rd
- 30 Inverness Rd
- 69 Tanager St
- 14 Inverness Rd
- 73 Tanager St
- 65 Tanager St
- 6 Kilsythe Rd
- 36 Inverness Rd
- 31 Inverness Rd
- 15 Inverness Rd
- 77 Tanager St
- 77 Tanager St Unit 1
- 37 Inverness Rd
- 7 Kilsythe Rd
- 10 Inverness Rd
- 61 Tanager St
- 55 Tanager St
- 55 Tanager St Unit 2
- 39 Inverness Rd