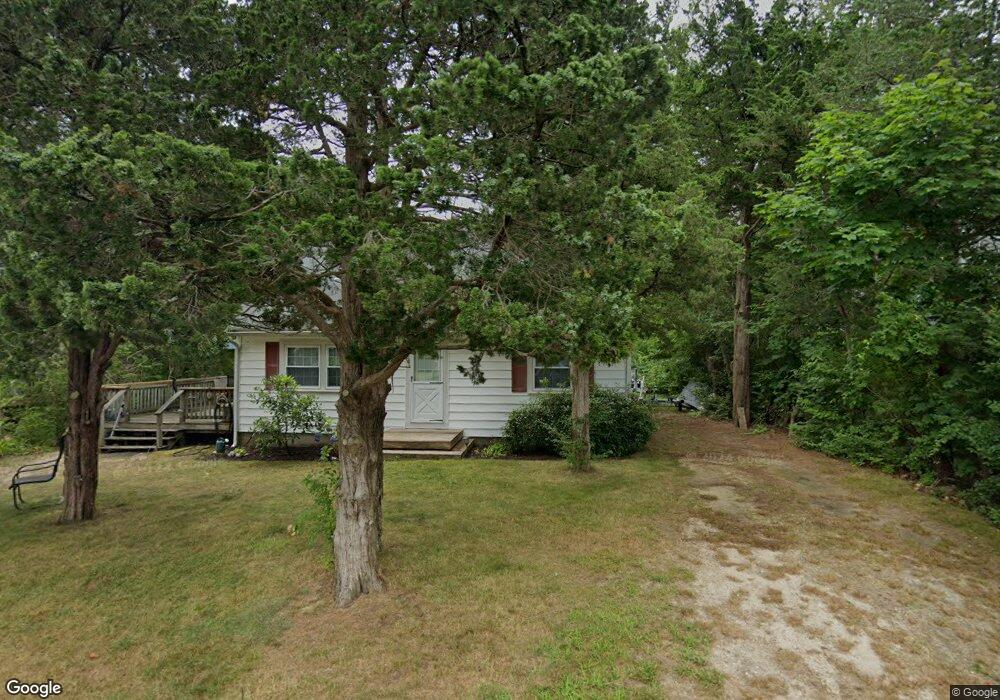
26 Kendrick Ln Pocasset, MA 02559
Pocasset NeighborhoodEstimated Value: $473,000 - $670,000
3
Beds
1
Bath
1,238
Sq Ft
$482/Sq Ft
Est. Value
About This Home
This home is located at 26 Kendrick Ln, Pocasset, MA 02559 and is currently estimated at $596,340, approximately $481 per square foot. 26 Kendrick Ln is a home located in Barnstable County with nearby schools including Bourne High School and Cadence Academy Preschool - Bourne.
Ownership History
Date
Name
Owned For
Owner Type
Purchase Details
Closed on
Mar 20, 2018
Sold by
Flanagan Brian G and Flanagan Denise A
Bought by
Brian G Flanagan T G and Brian Flanagan
Current Estimated Value
Purchase Details
Closed on
Jan 30, 2018
Sold by
Flanagan Brian G and Flanagan Denise A
Bought by
Brian G Flanagan T G and Brian Flanagan
Purchase Details
Closed on
Sep 20, 1996
Sold by
Flanagan Sylvia
Bought by
Flanagan Denise A and Flanagan Brian G
Home Financials for this Owner
Home Financials are based on the most recent Mortgage that was taken out on this home.
Original Mortgage
$59,500
Interest Rate
7.89%
Mortgage Type
Purchase Money Mortgage
Create a Home Valuation Report for This Property
The Home Valuation Report is an in-depth analysis detailing your home's value as well as a comparison with similar homes in the area
Home Values in the Area
Average Home Value in this Area
Purchase History
| Date | Buyer | Sale Price | Title Company |
|---|---|---|---|
| Brian G Flanagan T G | -- | -- | |
| Brian G Flanagan T G | -- | -- | |
| Brian G Flanagan T G | -- | -- | |
| Brian G Flanagan T G | -- | -- | |
| Flanagan Denise A | $85,000 | -- | |
| Flanagan Denise A | $85,000 | -- |
Source: Public Records
Mortgage History
| Date | Status | Borrower | Loan Amount |
|---|---|---|---|
| Previous Owner | Flanagan Denise A | $125,000 | |
| Previous Owner | Flanagan Denise A | $59,500 |
Source: Public Records
Tax History Compared to Growth
Tax History
| Year | Tax Paid | Tax Assessment Tax Assessment Total Assessment is a certain percentage of the fair market value that is determined by local assessors to be the total taxable value of land and additions on the property. | Land | Improvement |
|---|---|---|---|---|
| 2025 | $3,846 | $492,400 | $282,700 | $209,700 |
| 2024 | $3,668 | $457,400 | $269,200 | $188,200 |
| 2023 | $3,568 | $405,000 | $238,300 | $166,700 |
| 2022 | $3,266 | $323,700 | $191,100 | $132,600 |
| 2021 | $3,174 | $294,700 | $173,900 | $120,800 |
| 2020 | $3,031 | $282,200 | $172,200 | $110,000 |
| 2019 | $2,902 | $276,100 | $172,200 | $103,900 |
| 2018 | $2,774 | $263,200 | $164,100 | $99,100 |
| 2017 | $2,684 | $260,600 | $162,500 | $98,100 |
| 2016 | $2,602 | $256,100 | $162,500 | $93,600 |
| 2015 | $2,579 | $256,100 | $162,500 | $93,600 |
Source: Public Records
Map
Nearby Homes