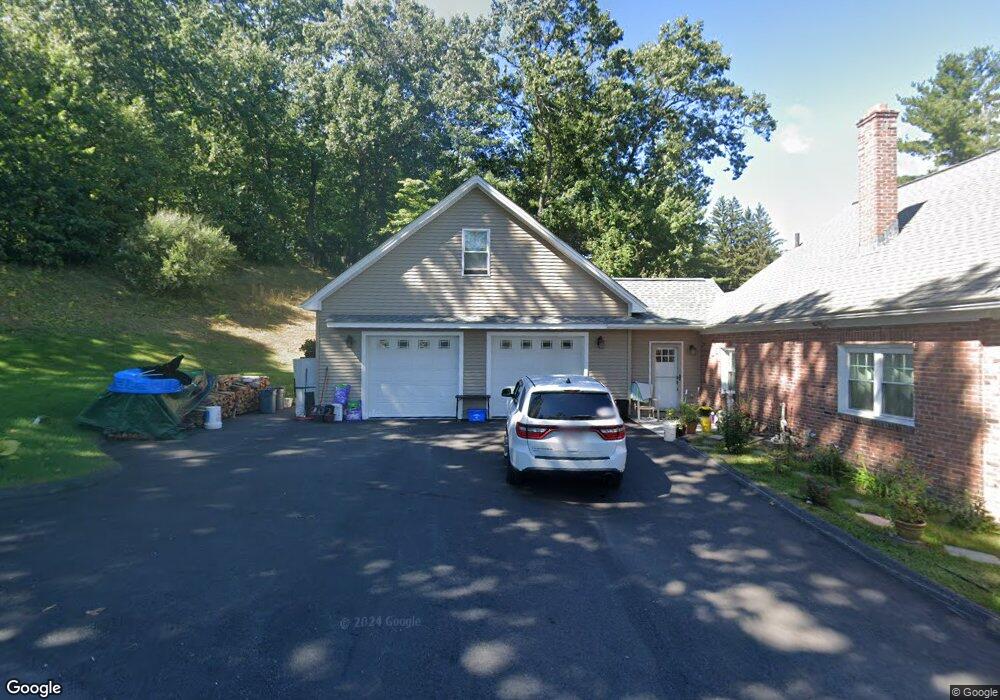
26 Kendrick St South Hadley, MA 01075
Estimated Value: $338,000 - $404,946
3
Beds
2
Baths
1,933
Sq Ft
$198/Sq Ft
Est. Value
About This Home
This home is located at 26 Kendrick St, South Hadley, MA 01075 and is currently estimated at $382,237, approximately $197 per square foot. 26 Kendrick St is a home located in Hampshire County with nearby schools including Plains Elementary School, Mosier Elementary School, and Michael E. Smith Middle School.
Ownership History
Date
Name
Owned For
Owner Type
Purchase Details
Closed on
Mar 11, 2022
Sold by
Bernier David W
Bought by
Bernier David W and Bernier Joanne C
Current Estimated Value
Home Financials for this Owner
Home Financials are based on the most recent Mortgage that was taken out on this home.
Original Mortgage
$210,000
Outstanding Balance
$196,052
Interest Rate
3.85%
Mortgage Type
Stand Alone Refi Refinance Of Original Loan
Estimated Equity
$186,185
Purchase Details
Closed on
Aug 30, 2012
Sold by
Bernier Arthur J Est
Bought by
Bernier David W
Home Financials for this Owner
Home Financials are based on the most recent Mortgage that was taken out on this home.
Original Mortgage
$100,000
Interest Rate
3.56%
Mortgage Type
New Conventional
Create a Home Valuation Report for This Property
The Home Valuation Report is an in-depth analysis detailing your home's value as well as a comparison with similar homes in the area
Home Values in the Area
Average Home Value in this Area
Purchase History
| Date | Buyer | Sale Price | Title Company |
|---|---|---|---|
| Bernier David W | -- | None Available | |
| Bernier David W | -- | None Available | |
| Bernier David W | $157,000 | -- |
Source: Public Records
Mortgage History
| Date | Status | Borrower | Loan Amount |
|---|---|---|---|
| Open | Bernier David W | $210,000 | |
| Closed | Bernier David W | $210,000 | |
| Previous Owner | Bernier David W | $100,000 |
Source: Public Records
Tax History Compared to Growth
Tax History
| Year | Tax Paid | Tax Assessment Tax Assessment Total Assessment is a certain percentage of the fair market value that is determined by local assessors to be the total taxable value of land and additions on the property. | Land | Improvement |
|---|---|---|---|---|
| 2025 | $5,534 | $347,400 | $88,600 | $258,800 |
| 2024 | $5,566 | $334,300 | $82,800 | $251,500 |
| 2023 | $5,309 | $302,500 | $75,200 | $227,300 |
| 2022 | $4,984 | $269,700 | $75,200 | $194,500 |
| 2021 | $565 | $208,000 | $70,300 | $137,700 |
| 2020 | $560 | $173,100 | $70,300 | $102,800 |
| 2019 | $54 | $168,900 | $67,000 | $101,900 |
| 2018 | $3,276 | $164,400 | $65,000 | $99,400 |
| 2017 | $3,165 | $157,300 | $65,000 | $92,300 |
| 2016 | $3,105 | $156,400 | $65,000 | $91,400 |
| 2015 | $2,946 | $152,000 | $63,100 | $88,900 |
Source: Public Records
Map
Nearby Homes