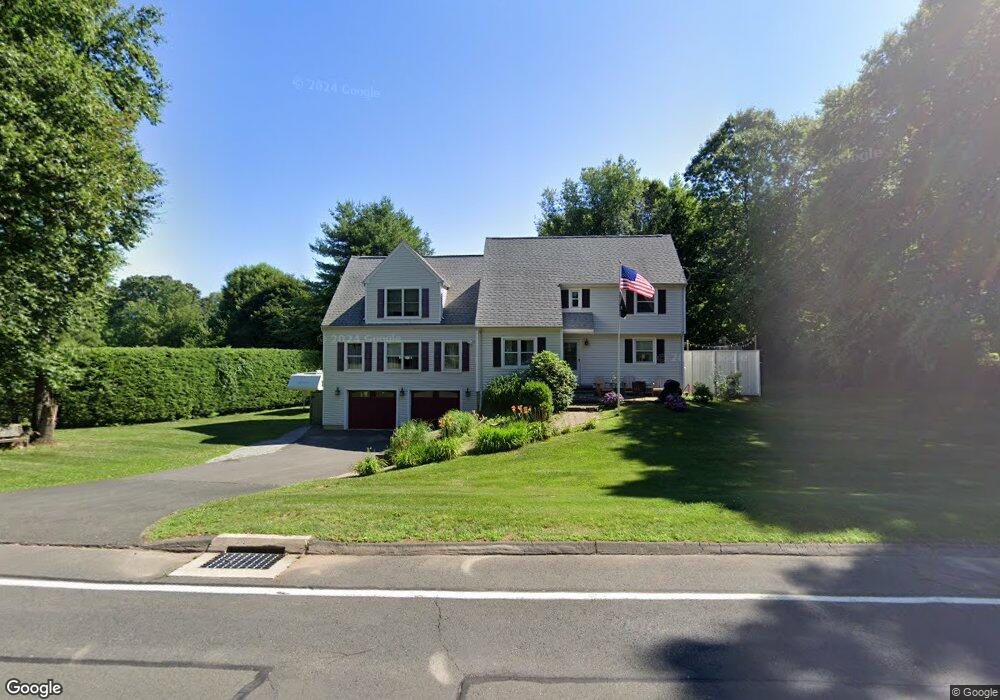
26 Lang Rd Windsor, CT 06095
West Windsor NeighborhoodEstimated Value: $481,454 - $561,000
4
Beds
3
Baths
2,276
Sq Ft
$229/Sq Ft
Est. Value
About This Home
This home is located at 26 Lang Rd, Windsor, CT 06095 and is currently estimated at $521,864, approximately $229 per square foot. 26 Lang Rd is a home located in Hartford County with nearby schools including Poquonock Elementary School, Clover Street School, and Sage Park Middle School.
Ownership History
Date
Name
Owned For
Owner Type
Purchase Details
Closed on
Mar 30, 2012
Sold by
Steele Michelle C
Bought by
Steele Richard F
Current Estimated Value
Home Financials for this Owner
Home Financials are based on the most recent Mortgage that was taken out on this home.
Original Mortgage
$275,231
Outstanding Balance
$189,154
Interest Rate
3.88%
Mortgage Type
New Conventional
Estimated Equity
$332,710
Purchase Details
Closed on
Jul 19, 1996
Sold by
Westerholm Steven and Westerholm Katherine
Bought by
Manion Edward and Manion Susan
Home Financials for this Owner
Home Financials are based on the most recent Mortgage that was taken out on this home.
Original Mortgage
$109,600
Interest Rate
8.28%
Mortgage Type
Purchase Money Mortgage
Purchase Details
Closed on
Mar 3, 1987
Sold by
Henaghan Wm
Bought by
Westerholm Ssteven
Create a Home Valuation Report for This Property
The Home Valuation Report is an in-depth analysis detailing your home's value as well as a comparison with similar homes in the area
Home Values in the Area
Average Home Value in this Area
Purchase History
| Date | Buyer | Sale Price | Title Company |
|---|---|---|---|
| Steele Richard F | -- | -- | |
| Manion Edward | $137,000 | -- | |
| Westerholm Ssteven | $159,000 | -- |
Source: Public Records
Mortgage History
| Date | Status | Borrower | Loan Amount |
|---|---|---|---|
| Open | Westerholm Ssteven | $275,231 | |
| Previous Owner | Westerholm Ssteven | $298,513 | |
| Previous Owner | Westerholm Ssteven | $149,300 | |
| Previous Owner | Westerholm Ssteven | $109,600 |
Source: Public Records
Tax History
| Year | Tax Paid | Tax Assessment Tax Assessment Total Assessment is a certain percentage of the fair market value that is determined by local assessors to be the total taxable value of land and additions on the property. | Land | Improvement |
|---|---|---|---|---|
| 2025 | $7,986 | $280,700 | $75,250 | $205,450 |
| 2024 | $8,511 | $280,700 | $75,250 | $205,450 |
| 2023 | $6,534 | $194,460 | $61,180 | $133,280 |
| 2022 | $6,470 | $194,460 | $61,180 | $133,280 |
| 2021 | $6,470 | $194,460 | $61,180 | $133,280 |
| 2020 | $6,439 | $194,460 | $61,180 | $133,280 |
| 2019 | $6,297 | $194,460 | $61,180 | $133,280 |
| 2018 | $6,126 | $185,850 | $61,180 | $124,670 |
| 2017 | $6,031 | $185,850 | $61,180 | $124,670 |
| 2016 | $5,858 | $185,850 | $61,180 | $124,670 |
| 2015 | $5,746 | $185,850 | $61,180 | $124,670 |
| 2014 | $5,663 | $185,850 | $61,180 | $124,670 |
Source: Public Records
Map
Nearby Homes
- 10 Cleary Ln
- 24 Mary Catherine Cir
- 1 Deanne Lynn Cir
- 16 Hilltop Rd
- 109 Old Village Cir
- 823 Stone Rd
- 22 Eastview Dr
- 39 Loren Cir
- 1946 Poquonock Ave
- 999 Stone Rd
- 22 Apple Tree Ln
- 58 Hollow Brook Rd
- 25 High St
- 490 Old Day Hill Rd
- 16 Cornfield Rd
- 485 River St
- 0 Walnut and Larch Dr
- 118 High Path Rd Unit 118
- 136 High Path Rd
- 98 High Path Rd
Your Personal Tour Guide
Ask me questions while you tour the home.