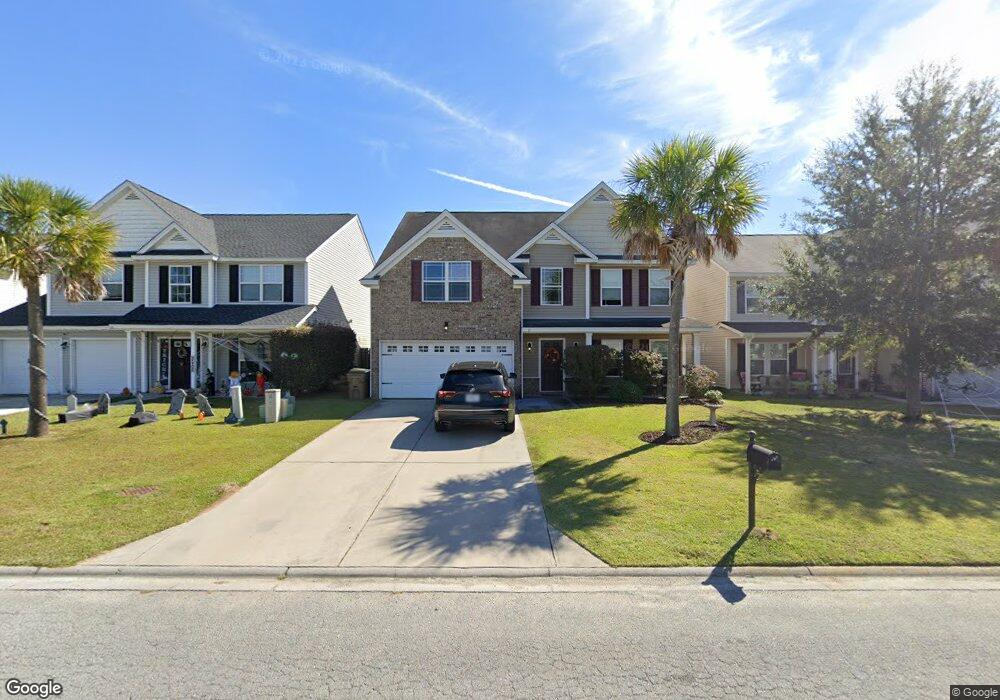
26 Laurel Ln Savannah, GA 31407
Estimated Value: $337,000 - $357,000
4
Beds
2
Baths
2,914
Sq Ft
$121/Sq Ft
Est. Value
About This Home
This home is located at 26 Laurel Ln, Savannah, GA 31407 and is currently estimated at $351,714, approximately $120 per square foot. 26 Laurel Ln is a home located in Chatham County with nearby schools including Rice Creek K-8 School, Groves High School, and Savannah Adventist Christian School.
Ownership History
Date
Name
Owned For
Owner Type
Purchase Details
Closed on
Aug 1, 2017
Sold by
Edwards Daniel C
Bought by
Brown Jynell D
Current Estimated Value
Home Financials for this Owner
Home Financials are based on the most recent Mortgage that was taken out on this home.
Original Mortgage
$216,558
Outstanding Balance
$179,834
Interest Rate
3.96%
Mortgage Type
VA
Estimated Equity
$171,880
Purchase Details
Closed on
Apr 16, 2010
Sold by
Brodie Builders Inc
Bought by
Edwards Daniel C and Edwards Katie G
Home Financials for this Owner
Home Financials are based on the most recent Mortgage that was taken out on this home.
Original Mortgage
$197,806
Interest Rate
4.94%
Mortgage Type
New Conventional
Purchase Details
Closed on
Jan 27, 2010
Sold by
Cherokee Nation Llc
Bought by
Brodie Builders Inc
Purchase Details
Closed on
Jul 22, 2008
Sold by
Not Provided
Bought by
Edwards Daniel C and Edwards Katie G
Create a Home Valuation Report for This Property
The Home Valuation Report is an in-depth analysis detailing your home's value as well as a comparison with similar homes in the area
Home Values in the Area
Average Home Value in this Area
Purchase History
| Date | Buyer | Sale Price | Title Company |
|---|---|---|---|
| Brown Jynell D | $212,000 | -- | |
| Edwards Daniel C | $193,850 | -- | |
| Brodie Builders Inc | $76,000 | -- | |
| Edwards Daniel C | -- | -- |
Source: Public Records
Mortgage History
| Date | Status | Borrower | Loan Amount |
|---|---|---|---|
| Open | Brown Jynell D | $216,558 | |
| Previous Owner | Edwards Daniel C | $197,806 |
Source: Public Records
Tax History Compared to Growth
Tax History
| Year | Tax Paid | Tax Assessment Tax Assessment Total Assessment is a certain percentage of the fair market value that is determined by local assessors to be the total taxable value of land and additions on the property. | Land | Improvement |
|---|---|---|---|---|
| 2025 | $5,081 | $152,280 | $24,000 | $128,280 |
| 2024 | $5,081 | $133,520 | $22,000 | $111,520 |
| 2023 | $3,789 | $117,280 | $14,000 | $103,280 |
| 2022 | $3,152 | $107,040 | $14,000 | $93,040 |
| 2021 | $3,376 | $93,160 | $14,000 | $79,160 |
| 2020 | $2,967 | $78,160 | $14,000 | $64,160 |
| 2019 | $2,967 | $85,800 | $14,000 | $71,800 |
| 2018 | $2,905 | $83,000 | $14,000 | $69,000 |
| 2017 | $2,407 | $73,520 | $14,000 | $59,520 |
| 2016 | $2,380 | $72,680 | $14,000 | $58,680 |
| 2015 | $2,393 | $72,960 | $14,000 | $58,960 |
| 2014 | $3,680 | $73,880 | $0 | $0 |
Source: Public Records
Map
Nearby Homes
- 135 Fox Glen Ct
- 8 Brown Thrasher Ct
- 167 Fox Glen Ct
- 31 Red Robin Ct
- 22 Roseberry Cir
- 15 Amber Dr
- 29 Springwater Dr
- 54 Hawkhorn Ct
- 1 Braxton Manor Dr
- 629 & 631 Meinhard Rd
- 42 Braxton Manor Dr
- 44 Braxton Manor Dr
- 34 Rivermoor Ct
- 6 Falkland Ave
- 15 Hawkhorn Ct
- 29 Godley Park Way
- 12 Greatwood Way
- 34 Twin Oaks Place
- 28 Twin Oaks Place
- 430 Punkin Bridge Rd