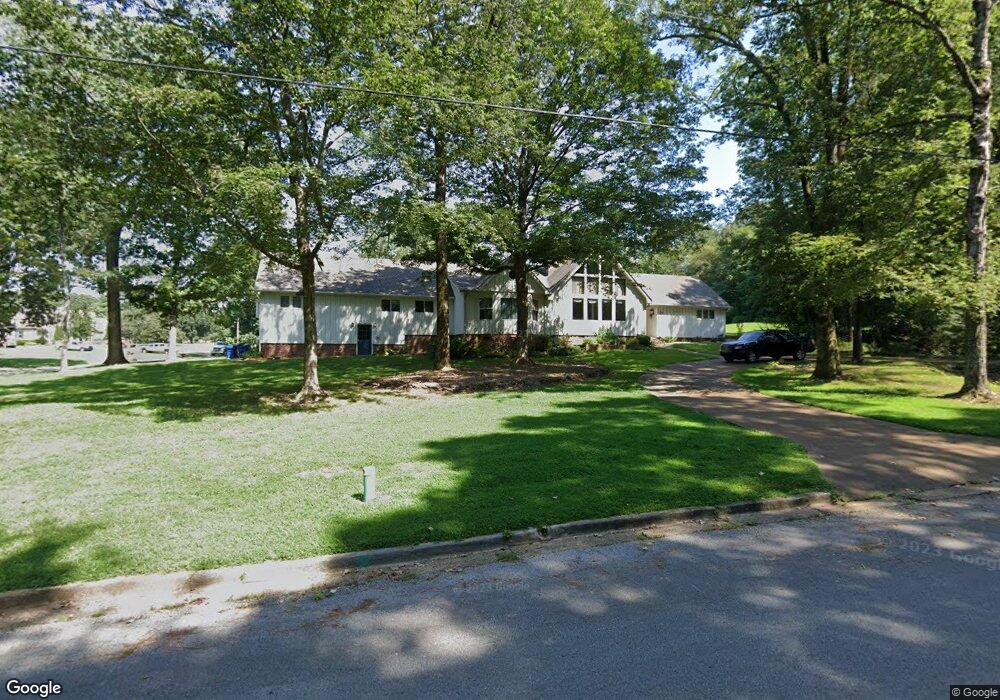
26 Leewood Dr Humboldt, TN 38343
Estimated Value: $344,000 - $507,000
--
Bed
4
Baths
3,568
Sq Ft
$117/Sq Ft
Est. Value
About This Home
This home is located at 26 Leewood Dr, Humboldt, TN 38343 and is currently estimated at $417,186, approximately $116 per square foot. 26 Leewood Dr is a home located in Gibson County with nearby schools including Stigall Primary School, East Elementary School, and Humboldt Middle School.
Ownership History
Date
Name
Owned For
Owner Type
Purchase Details
Closed on
Feb 12, 2020
Sold by
Howard Rita Louise
Bought by
Kluck Kristin R and Kluck Ted A
Current Estimated Value
Home Financials for this Owner
Home Financials are based on the most recent Mortgage that was taken out on this home.
Original Mortgage
$177,146
Outstanding Balance
$156,850
Interest Rate
3.6%
Mortgage Type
FHA
Estimated Equity
$260,336
Purchase Details
Closed on
Dec 8, 2000
Sold by
Wray Ann
Bought by
Howard Rita L
Purchase Details
Closed on
Jun 4, 1994
Bought by
Kipp Helen P
Purchase Details
Closed on
Apr 21, 1989
Bought by
Sullivan Ann F
Purchase Details
Closed on
Sep 30, 1986
Bought by
Bartow Jefrey Dean and Sullivan Ann F
Purchase Details
Closed on
Jun 1, 1978
Bought by
Jackson Foye W
Purchase Details
Closed on
Jan 31, 1973
Bought by
Jackson Foye W and Jackson Wanda F
Create a Home Valuation Report for This Property
The Home Valuation Report is an in-depth analysis detailing your home's value as well as a comparison with similar homes in the area
Home Values in the Area
Average Home Value in this Area
Purchase History
| Date | Buyer | Sale Price | Title Company |
|---|---|---|---|
| Kluck Kristin R | $185,000 | -- | |
| Howard Rita L | $172,500 | -- | |
| Kipp Helen P | $210,000 | -- | |
| Sullivan Ann F | $12,300 | -- | |
| Bartow Jefrey Dean | $150,000 | -- | |
| Jackson Foye W | -- | -- | |
| Jackson Foye W | -- | -- |
Source: Public Records
Mortgage History
| Date | Status | Borrower | Loan Amount |
|---|---|---|---|
| Open | Kluck Kristin R | $177,146 |
Source: Public Records
Tax History Compared to Growth
Tax History
| Year | Tax Paid | Tax Assessment Tax Assessment Total Assessment is a certain percentage of the fair market value that is determined by local assessors to be the total taxable value of land and additions on the property. | Land | Improvement |
|---|---|---|---|---|
| 2024 | $2,715 | $100,200 | $11,250 | $88,950 |
| 2023 | $608 | $55,125 | $11,250 | $43,875 |
| 2022 | $569 | $55,125 | $11,250 | $43,875 |
| 2021 | $569 | $55,125 | $11,250 | $43,875 |
| 2020 | $2,074 | $55,125 | $11,250 | $43,875 |
| 2019 | $2,074 | $55,125 | $11,250 | $43,875 |
| 2018 | $2,117 | $52,175 | $11,250 | $40,925 |
| 2017 | $2,091 | $52,175 | $11,250 | $40,925 |
| 2016 | $2,091 | $52,175 | $11,250 | $40,925 |
| 2015 | $2,073 | $52,175 | $11,250 | $40,925 |
| 2014 | $2,073 | $52,175 | $11,250 | $40,925 |
Source: Public Records
Map
Nearby Homes
- 140 Forest Lake Dr
- 341 Kelly Dr
- 23 Forked Oak Ln
- 107 Medina Hwy
- 2809 Pritchard Ln
- 2799 Pritchard Ln
- 2810 Pritchard Ln
- 2811 Pritchard Ln
- 2812 Pritchard Ln
- 762 Alecia Page Cove
- 844 Leanne Dr
- 720 Teri Leigh Cove
- 600 Hwy 45 Bypass
- 604 Hillside Dr
- 295 Honeysuckle Ln
- 00 Pleasant Hill St
- 623 Forest Dr
- 171 N 28th Ave
- 2900 E Mitchell St
- 1012 Parkway Cove