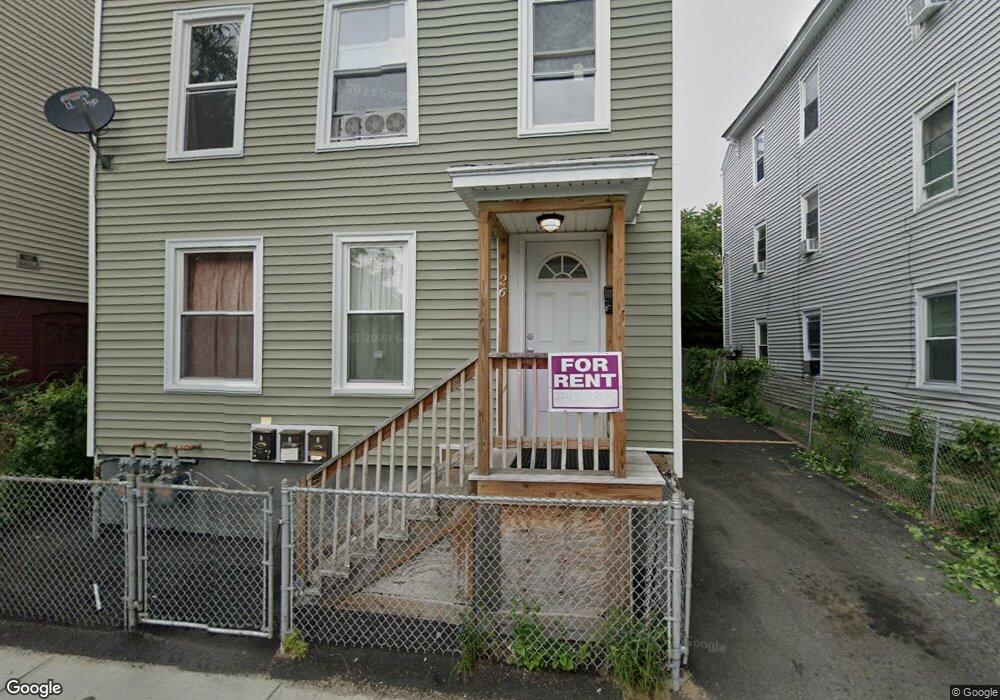
26 Lodi St Worcester, MA 01608
Green Island NeighborhoodEstimated Value: $429,000 - $743,000
6
Beds
3
Baths
3,255
Sq Ft
$178/Sq Ft
Est. Value
About This Home
This home is located at 26 Lodi St, Worcester, MA 01608 and is currently estimated at $578,000, approximately $177 per square foot. 26 Lodi St is a home located in Worcester County with nearby schools including Jacob Hiatt Magnet School, Chandler Elementary Community School, and Chandler Magnet.
Ownership History
Date
Name
Owned For
Owner Type
Purchase Details
Closed on
Sep 28, 2023
Sold by
Bermejo Luz A and Arcentales Cesar G
Bought by
Lnc Rt and Bermejo
Current Estimated Value
Purchase Details
Closed on
Apr 15, 2019
Sold by
Citimortgage Inc
Bought by
Arcentales Cesar G and Bermejo Luz
Purchase Details
Closed on
Dec 17, 2015
Sold by
Otano Jose and Citimortgage Inc
Bought by
Citimortgage Inc
Purchase Details
Closed on
Mar 15, 2004
Sold by
Mirante Genevieve and Bennett Sally V
Bought by
Otano Jose
Home Financials for this Owner
Home Financials are based on the most recent Mortgage that was taken out on this home.
Original Mortgage
$189,805
Interest Rate
5.67%
Mortgage Type
Purchase Money Mortgage
Purchase Details
Closed on
Apr 3, 2003
Sold by
Bigos Joseph
Bought by
Bennett Sally V
Home Financials for this Owner
Home Financials are based on the most recent Mortgage that was taken out on this home.
Original Mortgage
$14,500
Interest Rate
5.88%
Mortgage Type
Purchase Money Mortgage
Create a Home Valuation Report for This Property
The Home Valuation Report is an in-depth analysis detailing your home's value as well as a comparison with similar homes in the area
Home Values in the Area
Average Home Value in this Area
Purchase History
| Date | Buyer | Sale Price | Title Company |
|---|---|---|---|
| Lnc Rt | -- | None Available | |
| Lnc Rt | -- | None Available | |
| Arcentales Cesar G | $112,350 | -- | |
| Arcentales Cesar G | $112,350 | -- | |
| Citimortgage Inc | $151,200 | -- | |
| Citimortgage Inc | $151,200 | -- | |
| Otano Jose | $193,000 | -- | |
| Otano Jose | $193,000 | -- | |
| Bennett Sally V | $10,000 | -- | |
| Bennett Sally V | $10,000 | -- |
Source: Public Records
Mortgage History
| Date | Status | Borrower | Loan Amount |
|---|---|---|---|
| Previous Owner | Otano Jose | $189,805 | |
| Previous Owner | Bennett Sally V | $14,500 |
Source: Public Records
Tax History
| Year | Tax Paid | Tax Assessment Tax Assessment Total Assessment is a certain percentage of the fair market value that is determined by local assessors to be the total taxable value of land and additions on the property. | Land | Improvement |
|---|---|---|---|---|
| 2025 | $4,748 | $360,000 | $44,400 | $315,600 |
| 2024 | $4,360 | $317,100 | $44,400 | $272,700 |
| 2023 | $4,140 | $288,700 | $35,600 | $253,100 |
| 2022 | $3,603 | $236,900 | $28,500 | $208,400 |
| 2021 | $2,963 | $182,000 | $22,800 | $159,200 |
| 2020 | $2,528 | $148,700 | $22,900 | $125,800 |
| 2019 | $2,569 | $142,700 | $22,500 | $120,200 |
| 2018 | $2,407 | $127,300 | $22,500 | $104,800 |
| 2017 | $2,256 | $117,400 | $22,500 | $94,900 |
| 2016 | $2,214 | $107,400 | $19,300 | $88,100 |
| 2015 | $2,156 | $107,400 | $19,300 | $88,100 |
| 2014 | $2,099 | $107,400 | $19,300 | $88,100 |
Source: Public Records
Map
Nearby Homes
- 2 Lodi St Unit B
- 2 Lodi St Unit A
- 13 Sigel St
- 195 Millbury St
- 69 Oread St
- 49 Richland St
- 64 Green St
- 82 Fox St
- 70 Southbridge St Unit 611
- 70 Southbridge St Unit 310
- 70 Southbridge St Unit 703
- 79 Fox St
- 91 Fox St
- 12 Oread St
- 13 Sterling St
- 22 Waverly St
- 1 Arlington St
- 2 Preston St
- 32 Providence St Unit 5
- 9 Winthrop St
Your Personal Tour Guide
Ask me questions while you tour the home.