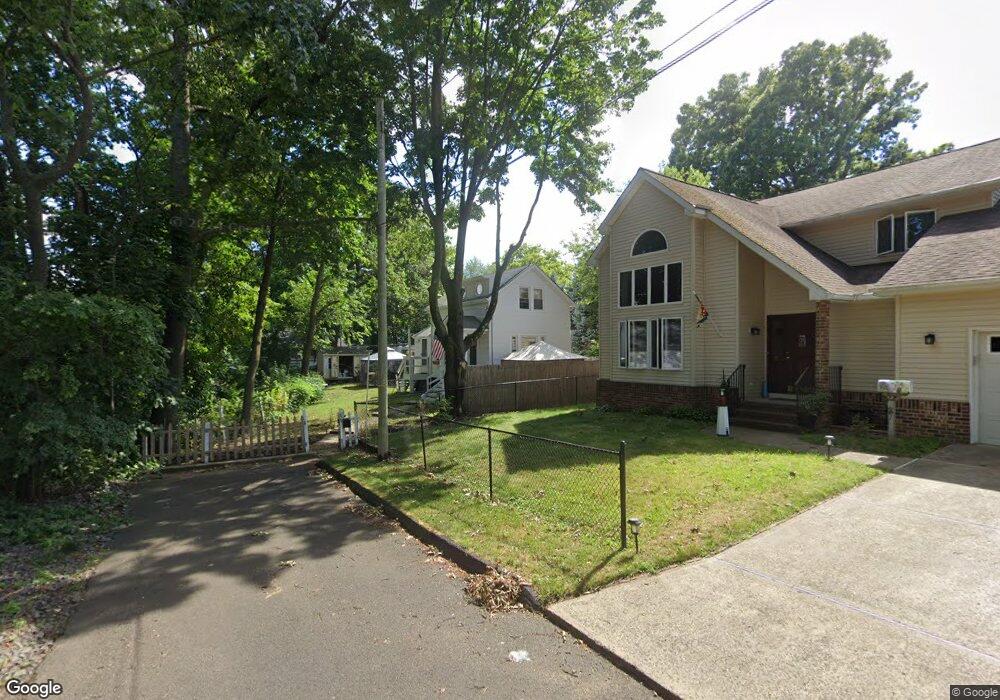
26 Luppatatong Ave Keyport, NJ 07735
Estimated Value: $326,913 - $380,000
1
Bed
1
Bath
632
Sq Ft
$576/Sq Ft
Est. Value
About This Home
This home is located at 26 Luppatatong Ave, Keyport, NJ 07735 and is currently estimated at $363,728, approximately $575 per square foot. 26 Luppatatong Ave is a home located in Monmouth County with nearby schools including Keyport Central School, Keyport High School, and Icob Academy.
Ownership History
Date
Name
Owned For
Owner Type
Purchase Details
Closed on
Jan 28, 2020
Sold by
Raciti Stevo and Teehan Debbie
Bought by
Raciti Steve and Teehan Debbie
Current Estimated Value
Purchase Details
Closed on
Mar 23, 2004
Sold by
Uchida Shari
Bought by
Raciti Steve and Teehan Debbie
Home Financials for this Owner
Home Financials are based on the most recent Mortgage that was taken out on this home.
Original Mortgage
$159,125
Outstanding Balance
$73,899
Interest Rate
5.58%
Estimated Equity
$289,829
Create a Home Valuation Report for This Property
The Home Valuation Report is an in-depth analysis detailing your home's value as well as a comparison with similar homes in the area
Home Values in the Area
Average Home Value in this Area
Purchase History
| Date | Buyer | Sale Price | Title Company |
|---|---|---|---|
| Raciti Steve | -- | None Available | |
| Raciti Steve | $167,500 | -- |
Source: Public Records
Mortgage History
| Date | Status | Borrower | Loan Amount |
|---|---|---|---|
| Open | Raciti Steve | $159,125 |
Source: Public Records
Tax History Compared to Growth
Tax History
| Year | Tax Paid | Tax Assessment Tax Assessment Total Assessment is a certain percentage of the fair market value that is determined by local assessors to be the total taxable value of land and additions on the property. | Land | Improvement |
|---|---|---|---|---|
| 2025 | $5,384 | $290,500 | $199,000 | $91,500 |
| 2024 | $5,264 | $260,100 | $173,100 | $87,000 |
| 2023 | $5,264 | $239,500 | $157,300 | $82,200 |
| 2022 | $4,674 | $208,200 | $136,800 | $71,400 |
| 2021 | $4,674 | $185,200 | $126,700 | $58,500 |
| 2020 | $4,511 | $177,400 | $121,700 | $55,700 |
| 2019 | $4,352 | $171,400 | $117,000 | $54,400 |
| 2018 | $4,365 | $167,900 | $117,000 | $50,900 |
| 2017 | $4,244 | $162,800 | $112,500 | $50,300 |
| 2016 | $4,141 | $160,200 | $112,500 | $47,700 |
| 2015 | $3,794 | $146,100 | $99,000 | $47,100 |
| 2014 | $3,284 | $127,700 | $76,500 | $51,200 |
Source: Public Records
Map
Nearby Homes
- 8 Chingarora Ave
- 95 Broadway
- 127 Chingarora Ave
- 253 Broadway
- 1 Hobart St
- 52 Highway 35
- 9 Monmouth Place
- 324 Maple Place
- 226 Osborn St
- 90 Saint Peters Place
- 40 Church St
- 55 E Front St
- 22 Lower Main St
- 369 Riverdale Dr
- 195 Atlantic St
- 231 Atlantic St Unit 23
- 128 1st St
- 25-27 Brook Ave
- 910 Malden Dr
- 557 Lloyd Rd Unit B
- 22 Luppatatong Ave
- 41 Chingarora Ave
- 30 W 2 St
- 30 W 2nd St
- 35 Chingarora Ave
- 20 Luppatatong Ave
- 51 Chingarora Ave
- 23 Luppatatong Ave
- 25 Chingarora Ave
- 10 Luppatatong Ave
- 17 Chingarora Ave
- 21 Luppatatong Ave
- 53 Chingarora Ave
- 94 Luppatatong Ave
- 11 Luppatatong Ave
- 8 Luppatatong Ave
- 34 Chingarora Ave
- 25 W 2nd St
- 30 Chingarora Ave
- 11 Chingarora Ave