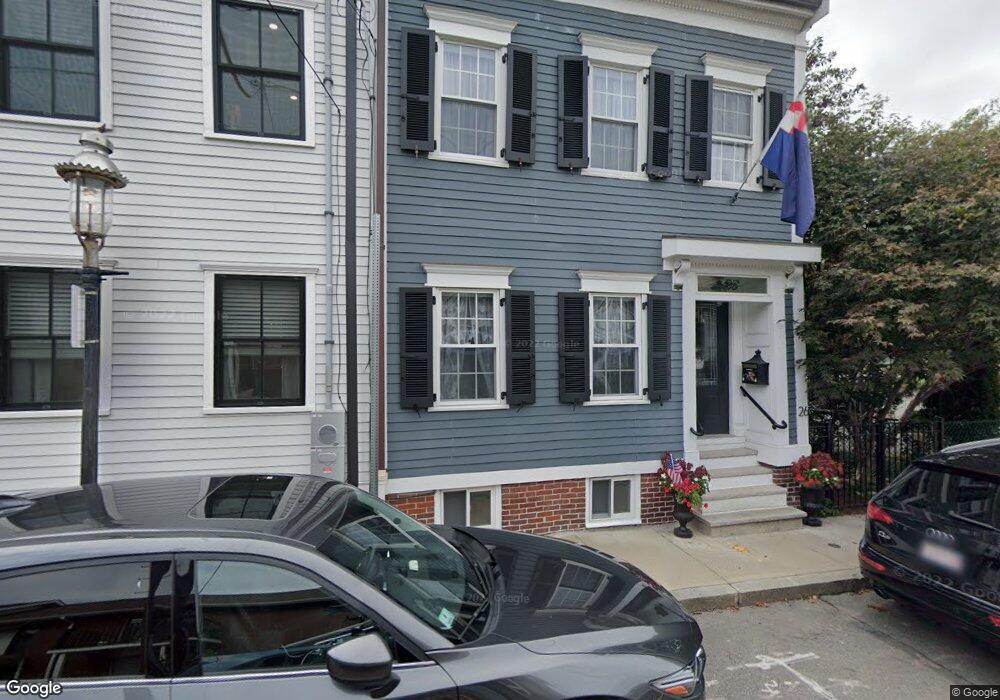
26 Lyndeboro St Charlestown, MA 02129
Thompson Square-Bunker Hill NeighborhoodEstimated Value: $1,109,000 - $1,319,000
2
Beds
3
Baths
1,436
Sq Ft
$860/Sq Ft
Est. Value
About This Home
This home is located at 26 Lyndeboro St, Charlestown, MA 02129 and is currently estimated at $1,235,083, approximately $860 per square foot. 26 Lyndeboro St is a home located in Suffolk County with nearby schools including Prospect Hill Academy Upper Elementary Campus and Boston Children's School.
Ownership History
Date
Name
Owned For
Owner Type
Purchase Details
Closed on
Aug 27, 2024
Sold by
Rolinson Robert
Bought by
26 Lyndeboro Street Rt and Rolinson
Current Estimated Value
Purchase Details
Closed on
Feb 26, 1999
Sold by
Oleary Leo P and Oleary Alice R
Bought by
Rolinson Robert
Home Financials for this Owner
Home Financials are based on the most recent Mortgage that was taken out on this home.
Original Mortgage
$163,906
Interest Rate
6.78%
Mortgage Type
Purchase Money Mortgage
Create a Home Valuation Report for This Property
The Home Valuation Report is an in-depth analysis detailing your home's value as well as a comparison with similar homes in the area
Home Values in the Area
Average Home Value in this Area
Purchase History
| Date | Buyer | Sale Price | Title Company |
|---|---|---|---|
| 26 Lyndeboro Street Rt | -- | None Available | |
| 26 Lyndeboro Street Rt | -- | None Available | |
| Rolinson Robert | $164,000 | -- | |
| Rolinson Robert | $164,000 | -- |
Source: Public Records
Mortgage History
| Date | Status | Borrower | Loan Amount |
|---|---|---|---|
| Previous Owner | Rolinson Robert | $158,335 | |
| Previous Owner | Rolinson Robert | $163,906 | |
| Previous Owner | Rolinson Robert | $15,000 |
Source: Public Records
Tax History Compared to Growth
Tax History
| Year | Tax Paid | Tax Assessment Tax Assessment Total Assessment is a certain percentage of the fair market value that is determined by local assessors to be the total taxable value of land and additions on the property. | Land | Improvement |
|---|---|---|---|---|
| 2025 | $12,172 | $1,051,100 | $263,700 | $787,400 |
| 2024 | $11,877 | $1,089,600 | $211,100 | $878,500 |
| 2023 | $11,147 | $1,037,900 | $201,100 | $836,800 |
| 2022 | $10,265 | $943,500 | $182,800 | $760,700 |
| 2021 | $8,970 | $840,700 | $179,200 | $661,500 |
| 2020 | $7,500 | $710,200 | $168,000 | $542,200 |
| 2019 | $7,165 | $679,800 | $134,400 | $545,400 |
| 2018 | $6,723 | $641,500 | $134,400 | $507,100 |
| 2017 | $6,288 | $593,800 | $134,400 | $459,400 |
| 2016 | $6,104 | $554,900 | $134,400 | $420,500 |
| 2015 | $6,513 | $537,800 | $163,600 | $374,200 |
| 2014 | $5,970 | $474,600 | $163,600 | $311,000 |
Source: Public Records
Map
Nearby Homes
- 9 Eden St Unit 3
- 16 Eden St Unit 1
- 103 Russell St Unit 2
- 29 Eden St Unit 3
- 339 Bunker Hill St
- 314A Bunker Hill St Unit 1
- 64 Walker St Unit 66
- 14 Wall St
- 33 Russell St
- 100 Baldwin St Unit 1
- 9 Short St
- 94A Bartlett St Unit 3
- 94A Bartlett St Unit 2
- 107 Baldwin St
- 52 Sullivan St Unit 1
- 19 Short St Unit 1
- 504 Medford St
- 15 Russell St
- 9 Russell St Unit 1
- 9 Russell St Unit 2
- 24 Lyndeboro St
- 20 Lyndeboro St
- 43 Essex St
- 41 Essex St
- 39 Essex St
- 18 Lyndeboro St
- 37 Essex St Unit 2
- 37 Essex St Unit 1
- 35 Essex St
- 33 Essex St
- 33 Essex St Unit 2
- 33 Essex St Unit 3
- 33 Essex St Unit 1
- 31 Essex St Unit 1
- 31 Essex St
- 29 Essex St Unit 2
- 29 Essex St Unit 1
- 29 Essex St
- 9 Lyndeboro St
- 27 Essex St