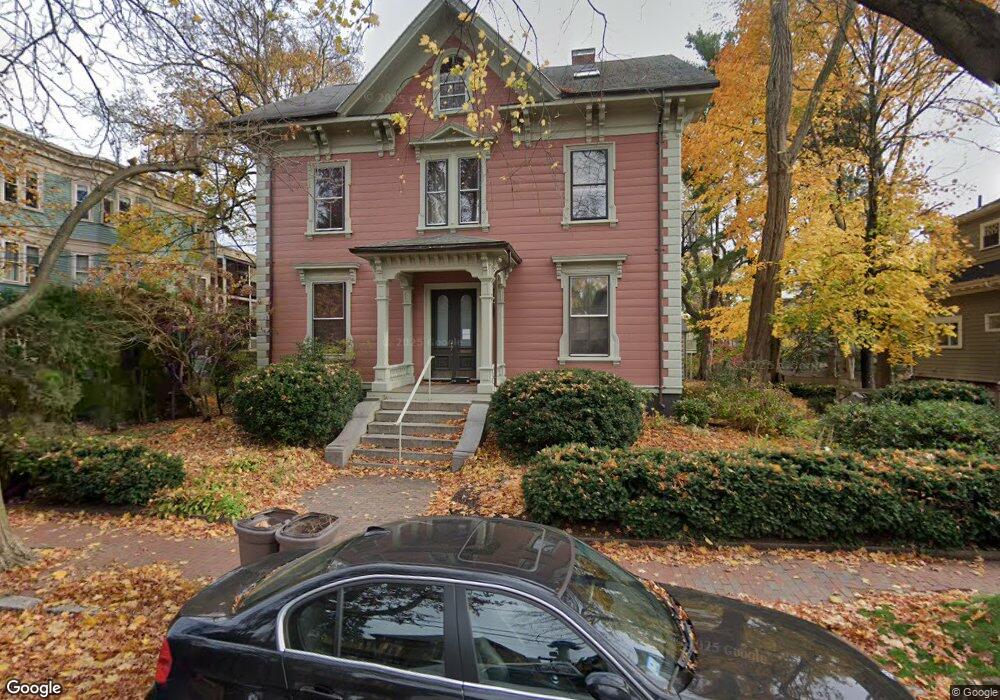
26 Maple Ave Unit 2 Cambridge, MA 02139
Mid-Cambridge NeighborhoodEstimated Value: $648,000 - $865,000
2
Beds
1
Bath
778
Sq Ft
$995/Sq Ft
Est. Value
About This Home
This home is located at 26 Maple Ave Unit 2, Cambridge, MA 02139 and is currently estimated at $773,899, approximately $994 per square foot. 26 Maple Ave Unit 2 is a home located in Middlesex County with nearby schools including Prospect Hill Academy Charter School and St. Paul's Choir School.
Ownership History
Date
Name
Owned For
Owner Type
Purchase Details
Closed on
Dec 9, 2003
Sold by
Ventura Jaume and Bolet Rose M
Bought by
Kline Joyce S
Current Estimated Value
Home Financials for this Owner
Home Financials are based on the most recent Mortgage that was taken out on this home.
Original Mortgage
$253,600
Outstanding Balance
$118,743
Interest Rate
6.03%
Mortgage Type
Purchase Money Mortgage
Estimated Equity
$655,156
Purchase Details
Closed on
Dec 1, 1997
Sold by
Berardi Kathleen and Sharpless Lincoln K
Bought by
Ventura Jaume and Bolet Rosa M
Home Financials for this Owner
Home Financials are based on the most recent Mortgage that was taken out on this home.
Original Mortgage
$150,000
Interest Rate
7.26%
Mortgage Type
Purchase Money Mortgage
Purchase Details
Closed on
Nov 16, 1994
Sold by
Deatley Suzanne
Bought by
Berardi Kathleen and Evans Robin Q
Home Financials for this Owner
Home Financials are based on the most recent Mortgage that was taken out on this home.
Original Mortgage
$96,000
Interest Rate
8.9%
Mortgage Type
Purchase Money Mortgage
Create a Home Valuation Report for This Property
The Home Valuation Report is an in-depth analysis detailing your home's value as well as a comparison with similar homes in the area
Home Values in the Area
Average Home Value in this Area
Purchase History
| Date | Buyer | Sale Price | Title Company |
|---|---|---|---|
| Kline Joyce S | $317,000 | -- | |
| Ventura Jaume | $178,000 | -- | |
| Ventura Jaume | $178,000 | -- | |
| Berardi Kathleen | $120,000 | -- | |
| Berardi Kathleen | $120,000 | -- |
Source: Public Records
Mortgage History
| Date | Status | Borrower | Loan Amount |
|---|---|---|---|
| Open | Kline Joyce S | $253,600 | |
| Previous Owner | Berardi Kathleen | $150,000 | |
| Previous Owner | Berardi Kathleen | $96,000 | |
| Closed | Berardi Kathleen | $25,200 |
Source: Public Records
Tax History
| Year | Tax Paid | Tax Assessment Tax Assessment Total Assessment is a certain percentage of the fair market value that is determined by local assessors to be the total taxable value of land and additions on the property. | Land | Improvement |
|---|---|---|---|---|
| 2025 | $4,832 | $761,000 | $0 | $761,000 |
| 2024 | $4,401 | $743,400 | $0 | $743,400 |
| 2023 | $4,373 | $746,200 | $0 | $746,200 |
| 2022 | $4,358 | $736,100 | $0 | $736,100 |
| 2021 | $4,238 | $724,400 | $0 | $724,400 |
| 2020 | $4,125 | $717,400 | $0 | $717,400 |
| 2019 | $3,958 | $666,300 | $0 | $666,300 |
| 2018 | $3,949 | $612,500 | $0 | $612,500 |
| 2017 | $3,645 | $561,700 | $0 | $561,700 |
| 2016 | $3,254 | $465,500 | $0 | $465,500 |
| 2015 | $3,222 | $412,000 | $0 | $412,000 |
| 2014 | $3,096 | $369,500 | $0 | $369,500 |
Source: Public Records
Map
Nearby Homes
- 17 Marie Ave Unit 3
- 67 Inman St
- 17 Ellsworth Ave Unit Front
- 33 Beacon St
- 405 Broadway
- 8 Chatham St Unit 4
- 5 Cooney St Unit 3
- 321 Harvard St Unit 307
- 321 Harvard St Unit 306
- 106 Ellery St
- 199 Prospect St Unit 1
- 329 Harvard St Unit 11
- 17 Buckingham St Unit 2
- 17 Buckingham St Unit 3
- 280 Harvard St Unit 2D
- 196 Prospect St
- 17 Dimick St
- 71 Oak St
- 190 Prospect St Unit 8
- 31 Tremont St
- 26 Maple Ave Unit 5
- 26 Maple Ave Unit 4
- 26 Maple Ave Unit 3
- 26 Maple Ave Unit 1
- 26 Maple Ave Unit 4,26
- 28 Maple Ave Unit 3
- 28 Maple Ave Unit 2
- 28 Maple Ave Unit 1
- 34 Maple Ave Unit 3
- 34 Maple Ave Unit 2
- 34 Maple Ave Unit 1
- 24 Maple Ave Unit 5
- 24 Maple Ave Unit 4
- 24 Maple Ave Unit 3
- 24 Maple Ave Unit 2
- 24 Maple Ave Unit 1
- 38 Maple Ave Unit 3
- 38 Maple Ave Unit 2
- 38 Maple Ave Unit 1
- 27 Fainwood Cir
Your Personal Tour Guide
Ask me questions while you tour the home.