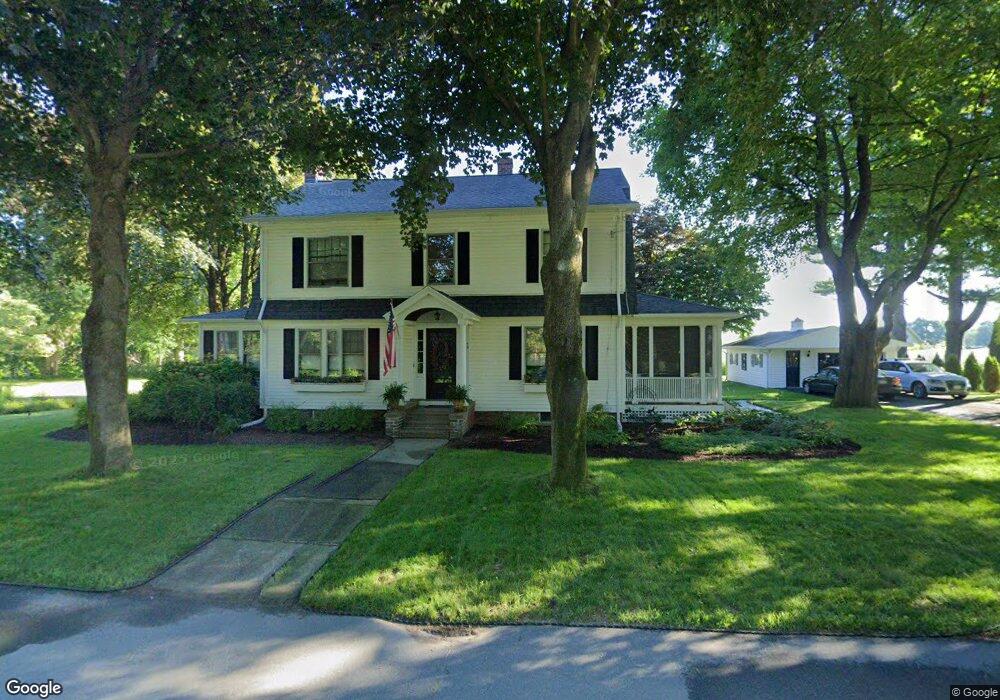
26 Maple St Hatfield, MA 01038
Estimated Value: $478,000 - $644,000
3
Beds
2
Baths
1,887
Sq Ft
$286/Sq Ft
Est. Value
About This Home
This home is located at 26 Maple St, Hatfield, MA 01038 and is currently estimated at $540,242, approximately $286 per square foot. 26 Maple St is a home located in Hampshire County with nearby schools including Hatfield Elementary School, Smith Academy, and The Montessori School of Northampton.
Ownership History
Date
Name
Owned For
Owner Type
Purchase Details
Closed on
Nov 17, 1999
Sold by
Markson Caryn B
Bought by
Moriarty Brian F and Moriarty Lynette A
Current Estimated Value
Purchase Details
Closed on
May 15, 1996
Sold by
Fortsch Hilda C and Fortsch John H
Bought by
Markson Caryn B
Create a Home Valuation Report for This Property
The Home Valuation Report is an in-depth analysis detailing your home's value as well as a comparison with similar homes in the area
Home Values in the Area
Average Home Value in this Area
Purchase History
| Date | Buyer | Sale Price | Title Company |
|---|---|---|---|
| Moriarty Brian F | $210,000 | -- | |
| Markson Caryn B | $186,500 | -- |
Source: Public Records
Mortgage History
| Date | Status | Borrower | Loan Amount |
|---|---|---|---|
| Open | Markson Caryn B | $272,800 | |
| Closed | Markson Caryn B | $97,000 | |
| Closed | Markson Caryn B | $213,000 |
Source: Public Records
Tax History
| Year | Tax Paid | Tax Assessment Tax Assessment Total Assessment is a certain percentage of the fair market value that is determined by local assessors to be the total taxable value of land and additions on the property. | Land | Improvement |
|---|---|---|---|---|
| 2025 | $6,750 | $487,700 | $175,300 | $312,400 |
| 2024 | $6,629 | $433,000 | $161,300 | $271,700 |
| 2023 | $5,511 | $408,800 | $152,500 | $256,300 |
| 2022 | $5,363 | $392,300 | $145,500 | $246,800 |
| 2021 | $5,097 | $359,200 | $131,500 | $227,700 |
| 2020 | $4,860 | $359,200 | $131,500 | $227,700 |
| 2019 | $4,648 | $334,600 | $122,700 | $211,900 |
| 2018 | $4,544 | $334,600 | $122,700 | $211,900 |
| 2017 | $4,371 | $330,600 | $122,700 | $207,900 |
| 2016 | $4,332 | $328,700 | $122,700 | $206,000 |
| 2015 | $4,145 | $314,700 | $117,500 | $197,200 |
| 2014 | $3,987 | $314,700 | $117,500 | $197,200 |
Source: Public Records
Map
Nearby Homes
- 18 Elm St
- 58 Main St Unit 4
- 58 Main St Unit 3
- 71 Chestnut St
- 27 River Dr
- 11 West St
- 149 Prospect St
- 0 N Branch Rd
- 0 Straits Rd
- 6 E Commons Dr Unit 6
- 26 Russell St Unit A-B
- 43 Laurel Park Unit 43
- 59 N Hatfield Rd
- 211 Russell St
- 128 West St
- 133 Middle St
- 121 Rocky Hill Rd
- 32 Stonewall Dr
- 83 Bay Rd
- 14 Hawley Rd
Your Personal Tour Guide
Ask me questions while you tour the home.