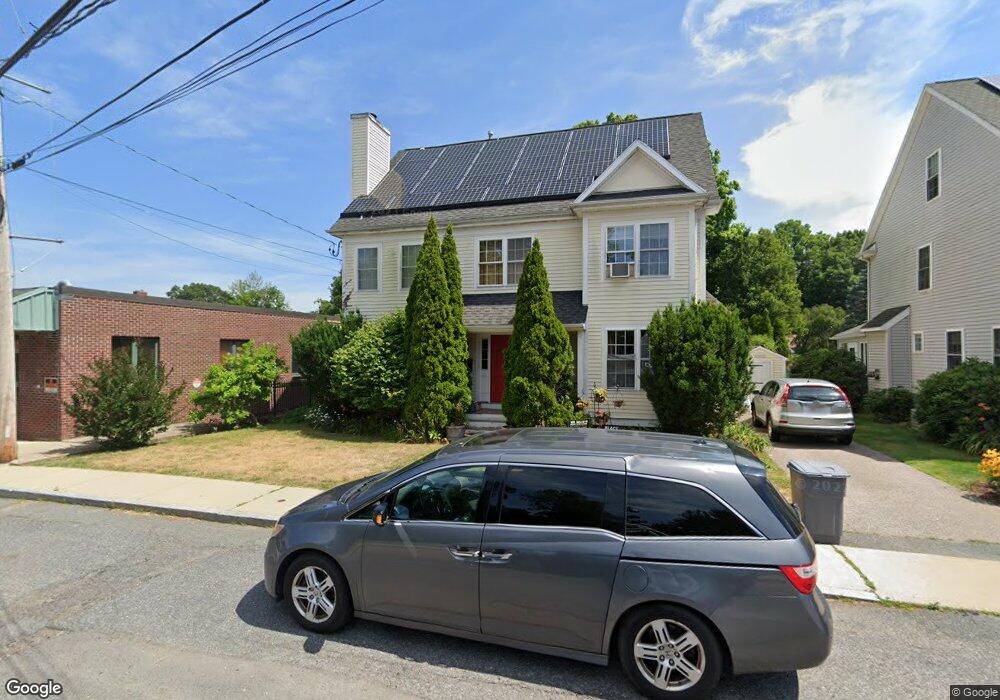
26 Morrell St West Roxbury, MA 02132
Upper Washington-Spring Street NeighborhoodEstimated Value: $1,093,000 - $1,417,000
4
Beds
3
Baths
2,406
Sq Ft
$496/Sq Ft
Est. Value
About This Home
This home is located at 26 Morrell St, West Roxbury, MA 02132 and is currently estimated at $1,193,012, approximately $495 per square foot. 26 Morrell St is a home located in Suffolk County with nearby schools including St Theresa School, Catholic Memorial School, and The Roxbury Latin School.
Ownership History
Date
Name
Owned For
Owner Type
Purchase Details
Closed on
Dec 8, 2009
Sold by
Benson John D and Benson Kay E
Bought by
26 Morrell Street Rt
Current Estimated Value
Purchase Details
Closed on
Aug 20, 2001
Sold by
Design Villas Lim Ptnr
Bought by
Benson John D and Benson Kay E
Home Financials for this Owner
Home Financials are based on the most recent Mortgage that was taken out on this home.
Original Mortgage
$387,600
Interest Rate
7.16%
Mortgage Type
Purchase Money Mortgage
Create a Home Valuation Report for This Property
The Home Valuation Report is an in-depth analysis detailing your home's value as well as a comparison with similar homes in the area
Home Values in the Area
Average Home Value in this Area
Purchase History
| Date | Buyer | Sale Price | Title Company |
|---|---|---|---|
| 26 Morrell Street Rt | -- | -- | |
| Benson John D | $484,521 | -- |
Source: Public Records
Mortgage History
| Date | Status | Borrower | Loan Amount |
|---|---|---|---|
| Previous Owner | Benson John D | $387,600 |
Source: Public Records
Tax History Compared to Growth
Tax History
| Year | Tax Paid | Tax Assessment Tax Assessment Total Assessment is a certain percentage of the fair market value that is determined by local assessors to be the total taxable value of land and additions on the property. | Land | Improvement |
|---|---|---|---|---|
| 2025 | $11,352 | $980,300 | $238,900 | $741,400 |
| 2024 | $10,508 | $964,000 | $243,600 | $720,400 |
| 2023 | $10,353 | $964,000 | $243,600 | $720,400 |
| 2022 | $9,534 | $876,300 | $221,400 | $654,900 |
| 2021 | $8,789 | $823,700 | $210,900 | $612,800 |
| 2020 | $7,669 | $726,200 | $197,500 | $528,700 |
| 2019 | $7,224 | $685,400 | $161,100 | $524,300 |
| 2018 | $6,649 | $634,400 | $161,100 | $473,300 |
| 2017 | $6,649 | $627,900 | $161,100 | $466,800 |
| 2016 | $6,270 | $570,000 | $161,100 | $408,900 |
| 2015 | $6,576 | $543,000 | $163,000 | $380,000 |
| 2014 | $6,383 | $507,400 | $163,000 | $344,400 |
Source: Public Records
Map
Nearby Homes
- 63 Johnson St
- 1214 Vfw Pkwy Unit 30
- 1214 Vfw Pkwy Unit 37
- 12 Bronx Rd
- 80 Caledonian Ave
- 2231 Centre St
- 46 Bayard St
- 340 Baker St Unit 1
- 14 Sanborn Ave
- 28 Dow Rd
- 27-29 Temple St
- 1515 Vfw Pkwy Unit M19
- 59 Chesbrough Rd
- 183 Temple St
- 105 Chesbrough Rd
- 14 Arbor Ln
- 73 Dent St Unit 1
- 425 Lagrange St Unit 203
- 110 New Haven St
- 55 Cottage Rd
- 28 Morrell St
- 28 Morrell St Unit 3
- 101 Cypress Unit 1,101
- 30 Morrell St
- 15 Cypress Terrace
- 20 Cypress St
- 32 Morrell St
- 32 Morrell St Unit 1
- 9 Cypress Terrace
- 14 Cypress Terrace
- 130 Laurie Ave
- 0 Moville St
- 33 Morrell St
- 5 Cypress Terrace
- 124 Laurie Ave
- 10 Cypress Terrace
- 136 Laurie Ave
- 120 Laurie Ave
- 214 Spring St
- 214 Spring St Unit 2