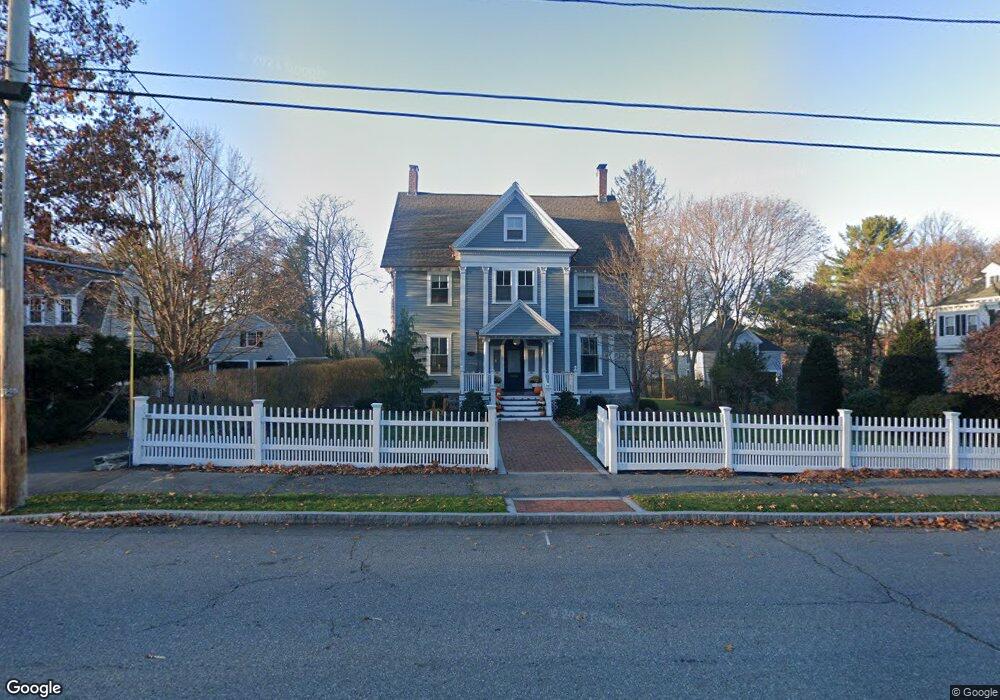
26 Morton St Andover, MA 01810
East Andover NeighborhoodEstimated Value: $1,785,503 - $2,245,000
7
Beds
4
Baths
3,936
Sq Ft
$503/Sq Ft
Est. Value
About This Home
This home is located at 26 Morton St, Andover, MA 01810 and is currently estimated at $1,981,126, approximately $503 per square foot. 26 Morton St is a home located in Essex County with nearby schools including Bancroft Elementary School, Doherty Middle School, and Andover High School.
Ownership History
Date
Name
Owned For
Owner Type
Purchase Details
Closed on
Mar 13, 2017
Sold by
Cosentino Kathleen and Cosentino David L
Bought by
Kathleen E Cosentino R E and Kathleen Cosentino
Current Estimated Value
Purchase Details
Closed on
May 14, 2010
Sold by
Johnston Jr Tr Hooks K and Johnston Susan Y
Bought by
Sohn Jennifer B and Baumgaertel Christian K
Create a Home Valuation Report for This Property
The Home Valuation Report is an in-depth analysis detailing your home's value as well as a comparison with similar homes in the area
Home Values in the Area
Average Home Value in this Area
Purchase History
| Date | Buyer | Sale Price | Title Company |
|---|---|---|---|
| Kathleen E Cosentino R E | -- | -- | |
| Kathleen E Cosentino R | -- | -- | |
| Sohn Jennifer B | $965,000 | -- | |
| Sohn Jennifer B | $965,000 | -- |
Source: Public Records
Mortgage History
| Date | Status | Borrower | Loan Amount |
|---|---|---|---|
| Previous Owner | Sohn Jennifer B | $523,250 |
Source: Public Records
Tax History Compared to Growth
Tax History
| Year | Tax Paid | Tax Assessment Tax Assessment Total Assessment is a certain percentage of the fair market value that is determined by local assessors to be the total taxable value of land and additions on the property. | Land | Improvement |
|---|---|---|---|---|
| 2024 | $18,216 | $1,414,300 | $743,600 | $670,700 |
| 2023 | $17,381 | $1,272,400 | $669,800 | $602,600 |
| 2022 | $16,686 | $1,142,900 | $592,700 | $550,200 |
| 2021 | $15,980 | $1,045,100 | $539,000 | $506,100 |
| 2020 | $15,328 | $1,021,200 | $525,800 | $495,400 |
| 2019 | $15,168 | $993,300 | $510,500 | $482,800 |
| 2018 | $14,307 | $914,800 | $481,600 | $433,200 |
| 2017 | $13,685 | $901,500 | $472,100 | $429,400 |
| 2016 | $13,360 | $901,500 | $472,100 | $429,400 |
| 2015 | $12,853 | $858,600 | $453,800 | $404,800 |
Source: Public Records
Map
Nearby Homes
- 31 Bartlet St
- 50 A Whittier St Unit 1
- 3 Weeping Willow Way
- 56 Central St
- 14 Summer St
- 61 Elm St Unit 61
- 65 Central St
- 47 Abbot St
- 7-9 Buxton Ct
- 7 Heather Dr
- 53 Salem St
- 22 Railroad St Unit 311
- 88 Central St
- 180 Chestnut St
- 16 Carmel Rd
- 105 Elm St Unit A
- 16 Cuba St
- 103 Central St
- 3 Willoughby Ln
- 204 Chestnut St
- 30 Morton St
- 60 Bartlet St
- 32 Morton St
- 29 Morton St
- 64 Bartlet St
- 22 Morton St
- 31 Morton St
- 61 Bartlet St
- 59 Bartlet St
- 18 Morton St
- 33 Morton St
- 8-10 Chapman Ave
- 10 Chapman Ave
- 8 Chapman Ave
- 8 Chapman Ave Unit 1
- 10 Chapman Ave Unit 10
- 10 Chapman Ave
- 51 Bartlet St Unit 53
- 36 Morton St
- 71 Bartlet St