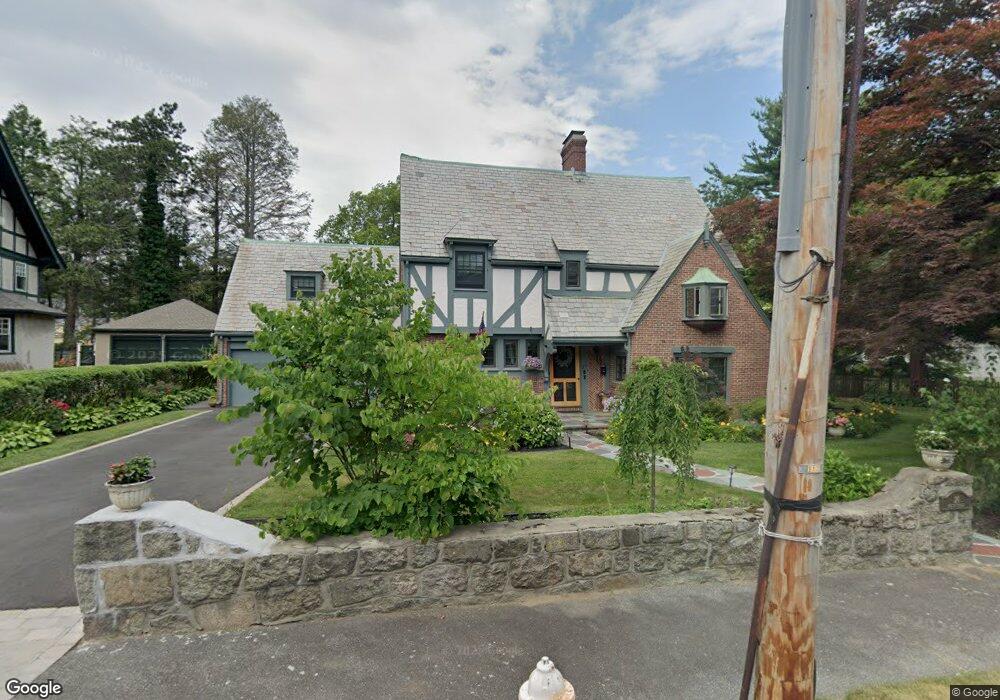
26 Mostyn St Swampscott, MA 01907
Estimated Value: $1,261,000 - $1,659,000
4
Beds
4
Baths
2,800
Sq Ft
$523/Sq Ft
Est. Value
About This Home
This home is located at 26 Mostyn St, Swampscott, MA 01907 and is currently estimated at $1,464,429, approximately $523 per square foot. 26 Mostyn St is a home located in Essex County with nearby schools including Swampscott Middle School, Swampscott High School, and Devereux School.
Ownership History
Date
Name
Owned For
Owner Type
Purchase Details
Closed on
Dec 15, 2016
Sold by
Kelleher John W and Kelleher Therese A
Bought by
Morris George and Morris Elizabeth
Current Estimated Value
Home Financials for this Owner
Home Financials are based on the most recent Mortgage that was taken out on this home.
Original Mortgage
$663,920
Outstanding Balance
$539,853
Interest Rate
3.54%
Mortgage Type
Purchase Money Mortgage
Estimated Equity
$924,576
Purchase Details
Closed on
Apr 23, 2010
Sold by
Jws Rt
Bought by
Kelleher John W and Kelleher Therese A
Home Financials for this Owner
Home Financials are based on the most recent Mortgage that was taken out on this home.
Original Mortgage
$105,000
Interest Rate
5%
Mortgage Type
Purchase Money Mortgage
Create a Home Valuation Report for This Property
The Home Valuation Report is an in-depth analysis detailing your home's value as well as a comparison with similar homes in the area
Home Values in the Area
Average Home Value in this Area
Purchase History
| Date | Buyer | Sale Price | Title Company |
|---|---|---|---|
| Morris George | $829,900 | -- | |
| Morris George | $829,900 | -- | |
| Kelleher John W | $700,000 | -- | |
| Kelleher John W | $700,000 | -- |
Source: Public Records
Mortgage History
| Date | Status | Borrower | Loan Amount |
|---|---|---|---|
| Open | Morris George | $663,920 | |
| Closed | Morris George | $663,920 | |
| Previous Owner | Kelleher John W | $523,500 | |
| Previous Owner | Kelleher John W | $105,000 | |
| Previous Owner | Kelleher John W | $523,750 |
Source: Public Records
Tax History
| Year | Tax Paid | Tax Assessment Tax Assessment Total Assessment is a certain percentage of the fair market value that is determined by local assessors to be the total taxable value of land and additions on the property. | Land | Improvement |
|---|---|---|---|---|
| 2025 | $14,257 | $1,243,000 | $462,600 | $780,400 |
| 2024 | $13,870 | $1,207,100 | $440,000 | $767,100 |
| 2023 | $12,356 | $1,052,500 | $394,900 | $657,600 |
| 2022 | $11,854 | $923,900 | $338,500 | $585,400 |
| 2021 | $11,701 | $847,900 | $315,900 | $532,000 |
| 2020 | $11,988 | $838,300 | $315,900 | $522,400 |
| 2019 | $12,399 | $815,700 | $293,300 | $522,400 |
| 2018 | $12,722 | $795,100 | $293,300 | $501,800 |
| 2017 | $11,554 | $662,100 | $270,800 | $391,300 |
| 2016 | $11,327 | $653,600 | $262,300 | $391,300 |
| 2015 | $11,209 | $653,600 | $262,300 | $391,300 |
| 2014 | $11,712 | $626,300 | $262,300 | $364,000 |
Source: Public Records
Map
Nearby Homes
- 11 Elbridge Ln Unit 11
- 212 Humphrey St Unit 205
- 2 Ocean Ave
- 16 Pickwick Rd
- 12 Pickwick Rd
- 11 Angenica Terrace
- 35 Alden Rd
- 4 Dean Rd
- 22 Hemenway Rd
- 1008 Paradise Rd Unit 1M
- 469 Loring Ave
- 1002 Paradise Rd Unit PHE
- 1004 Paradise Rd Unit 1K
- 1004 Paradise Rd Unit 1L
- 71 Walnut Rd
- 10 Arbutus Rd
- 110 Galloupes Point Rd
- 315 Puritan Rd
- 3 Didio Dr
- 34 Lafayette St
- 26 Mostyn St
- 38 Mostyn St
- 19 Mostyn St
- 20 Mostyn St
- 99 Beach Bluff Ave
- 21 Mostyn St
- 25 Mostyn St
- 97 Beach Bluff Ave
- 91 Beach Bluff Ave
- 15 Eulow St
- 15 Eulow St Unit 15
- 15 Eulow St
- 15 Eulow St Unit 1
- 15 Eulow St
- 3 Mostyn St
- 121 Beach Bluff Ave
- 11 Eulow St
- 35 Lincoln Cir
- 37 Estabrook Rd
- 35 Estabrook Rd
Your Personal Tour Guide
Ask me questions while you tour the home.