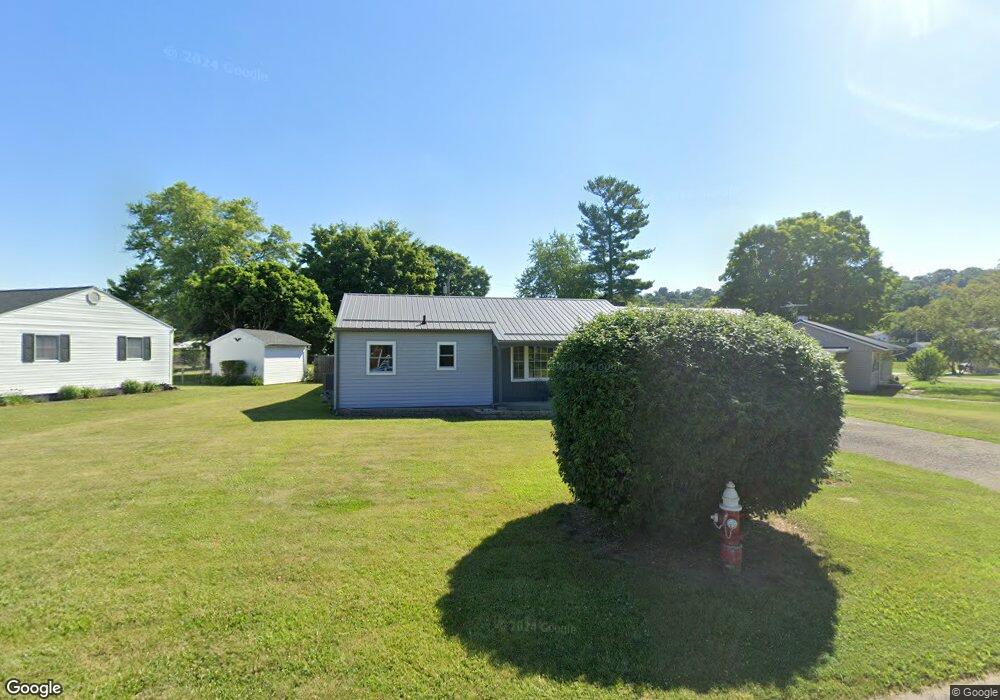
26 Northfork Dr Chillicothe, OH 45601
Estimated Value: $243,000 - $267,000
Studio
2
Baths
1,800
Sq Ft
$143/Sq Ft
Est. Value
About This Home
This home is located at 26 Northfork Dr, Chillicothe, OH 45601 and is currently estimated at $258,084, approximately $143 per square foot. 26 Northfork Dr is a home located in Ross County with nearby schools including Unioto Elementary School, Unioto Middle School, and Unioto High School.
Ownership History
Date
Name
Owned For
Owner Type
Purchase Details
Closed on
Oct 26, 2021
Sold by
Park Sam and Park Kathy
Bought by
Park Miriah and Bever Jordan S
Current Estimated Value
Home Financials for this Owner
Home Financials are based on the most recent Mortgage that was taken out on this home.
Original Mortgage
$146,515
Outstanding Balance
$134,049
Interest Rate
2.88%
Mortgage Type
New Conventional
Estimated Equity
$124,035
Purchase Details
Closed on
Oct 21, 2019
Sold by
Barnaby Elizabeth and Thacker Julie
Bought by
Park Miriah and Park Sam
Home Financials for this Owner
Home Financials are based on the most recent Mortgage that was taken out on this home.
Original Mortgage
$117,826
Interest Rate
3.7%
Mortgage Type
FHA
Purchase Details
Closed on
Sep 10, 2018
Sold by
Barnaby Elizabeth and Thacker Phillip A
Bought by
Barnaby Elizabeth
Purchase Details
Closed on
Mar 23, 2012
Sold by
Estate Of Claudia Chloe Thacker
Bought by
Thacker Phillip A
Create a Home Valuation Report for This Property
The Home Valuation Report is an in-depth analysis detailing your home's value as well as a comparison with similar homes in the area
Home Values in the Area
Average Home Value in this Area
Purchase History
| Date | Buyer | Sale Price | Title Company |
|---|---|---|---|
| Park Miriah | -- | Hallmark Title | |
| Park Miriah | $120,000 | Valmer Land Title Agency Box | |
| Barnaby Elizabeth | -- | None Available | |
| Thacker Phillip A | -- | None Available |
Source: Public Records
Mortgage History
| Date | Status | Borrower | Loan Amount |
|---|---|---|---|
| Open | Park Miriah | $146,515 | |
| Closed | Park Miriah | $117,826 |
Source: Public Records
Tax History
| Year | Tax Paid | Tax Assessment Tax Assessment Total Assessment is a certain percentage of the fair market value that is determined by local assessors to be the total taxable value of land and additions on the property. | Land | Improvement |
|---|---|---|---|---|
| 2024 | $2,295 | $61,610 | $7,890 | $53,720 |
| 2023 | $2,295 | $61,610 | $7,890 | $53,720 |
| 2022 | $2,341 | $61,610 | $7,890 | $53,720 |
| 2021 | $1,710 | $44,610 | $5,800 | $38,810 |
| 2020 | $1,718 | $44,610 | $5,800 | $38,810 |
| 2019 | $1,733 | $44,610 | $5,800 | $38,810 |
| 2018 | $1,225 | $40,290 | $5,800 | $34,490 |
| 2017 | $1,200 | $40,290 | $5,800 | $34,490 |
| 2016 | $1,179 | $40,290 | $5,800 | $34,490 |
| 2015 | $1,041 | $36,660 | $5,800 | $30,860 |
| 2014 | $1,015 | $36,660 | $5,800 | $30,860 |
| 2013 | $1,020 | $36,660 | $5,800 | $30,860 |
Source: Public Records
Map
Nearby Homes
- 1437 Valley Dr
- 239 Almahurst Dr
- 1310 Western Ave
- 4 Becky Ln
- 44 Banyas Blvd
- 27 Shawnee Dr
- 106 Stoneridge Ct Unit 106
- 1295 Randall Ct
- 18 Ridge Dr
- 320 Summerhill Dr
- 4 Ridge Dr
- 88 Fruit Hill Dr
- 1271 Porter Dr
- 53 Fruithill Dr
- 53 Fruit Hill Dr
- 26 Tecumseh Dr
- 94 Applewood Dr
- 15 Windsor Dr
- 1041 Edgewood Dr
- 231 Saint Claire Dr
Your Personal Tour Guide
Ask me questions while you tour the home.