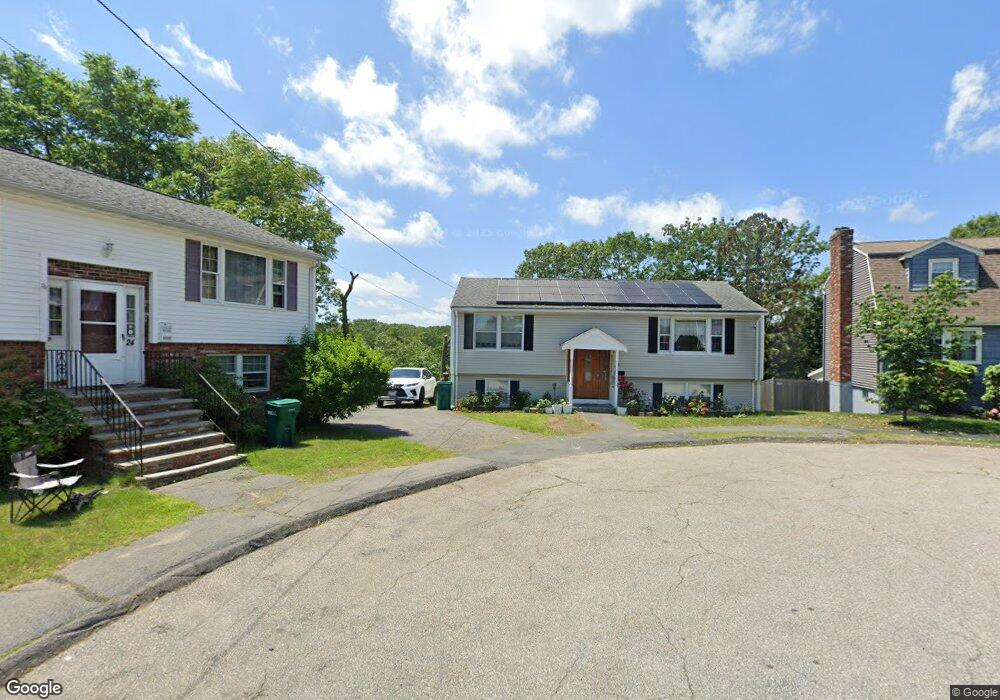
26 Oakcrest Rd Lynn, MA 01904
Fays Estate NeighborhoodEstimated Value: $558,000 - $697,000
2
Beds
2
Baths
955
Sq Ft
$631/Sq Ft
Est. Value
About This Home
This home is located at 26 Oakcrest Rd, Lynn, MA 01904 and is currently estimated at $602,990, approximately $631 per square foot. 26 Oakcrest Rd is a home located in Essex County with nearby schools including Aborn Elementary School, William R. Fallon School, and New Paths Area Learning Center.
Ownership History
Date
Name
Owned For
Owner Type
Purchase Details
Closed on
Mar 15, 2025
Sold by
Huy Noy S and Sok Socheath
Bought by
S Sok & Noy Sim Huy Irt and Huy
Current Estimated Value
Purchase Details
Closed on
Feb 5, 1998
Sold by
Marquis Raymond A
Bought by
Sok Socheath
Home Financials for this Owner
Home Financials are based on the most recent Mortgage that was taken out on this home.
Original Mortgage
$110,400
Interest Rate
6.95%
Mortgage Type
Purchase Money Mortgage
Purchase Details
Closed on
Jan 2, 1991
Sold by
Dodyk Harry
Bought by
Marquis Raymond
Home Financials for this Owner
Home Financials are based on the most recent Mortgage that was taken out on this home.
Original Mortgage
$106,000
Interest Rate
9.83%
Mortgage Type
Purchase Money Mortgage
Create a Home Valuation Report for This Property
The Home Valuation Report is an in-depth analysis detailing your home's value as well as a comparison with similar homes in the area
Home Values in the Area
Average Home Value in this Area
Purchase History
| Date | Buyer | Sale Price | Title Company |
|---|---|---|---|
| S Sok & Noy Sim Huy Irt | -- | None Available | |
| S Sok & Noy Sim Huy Irt | -- | None Available | |
| S Sok & Noy Sim Huy Irt | -- | None Available | |
| Sok Socheath | $138,000 | -- | |
| Sok Socheath | $138,000 | -- | |
| Sok Socheath | $138,000 | -- | |
| Marquis Raymond | $132,500 | -- | |
| Marquis Raymond | $132,500 | -- | |
| Marquis Raymond | $132,500 | -- |
Source: Public Records
Mortgage History
| Date | Status | Borrower | Loan Amount |
|---|---|---|---|
| Previous Owner | Sok Socheath | $110,400 | |
| Previous Owner | Marquis Raymond | $106,000 |
Source: Public Records
Tax History Compared to Growth
Tax History
| Year | Tax Paid | Tax Assessment Tax Assessment Total Assessment is a certain percentage of the fair market value that is determined by local assessors to be the total taxable value of land and additions on the property. | Land | Improvement |
|---|---|---|---|---|
| 2025 | $5,371 | $518,400 | $192,300 | $326,100 |
| 2024 | $5,375 | $510,400 | $184,300 | $326,100 |
| 2023 | $5,148 | $461,700 | $175,200 | $286,500 |
| 2022 | $5,058 | $406,900 | $145,600 | $261,300 |
| 2021 | $4,795 | $368,000 | $132,100 | $235,900 |
| 2020 | $4,768 | $355,800 | $135,100 | $220,700 |
| 2019 | $4,821 | $337,100 | $128,900 | $208,200 |
| 2018 | $4,572 | $301,800 | $126,000 | $175,800 |
| 2017 | $4,242 | $271,900 | $112,200 | $159,700 |
| 2016 | $4,430 | $273,800 | $96,800 | $177,000 |
| 2015 | $3,968 | $236,900 | $95,500 | $141,400 |
Source: Public Records
Map
Nearby Homes
- 73 Lockwood Rd
- 39 Kelly Ln
- 31 Spring View Dr
- 53 Kelly Ln
- 57 Kelly Ln
- 39 Graves Rd
- 31 Atkins Ave
- 22 Burdett Rd
- 112 Fays Ave
- 15 Magnolia Ave
- 101 Maple St
- 100 Magnolia Ave Unit 5
- 100 Magnolia Ave Unit 4
- 358 Broadway Unit 13
- 605 Eastern Ave Unit 211
- 5 Sherbrook Place
- 232 Lynn St
- 20 Lexington St
- 64 Bacheller St
- 34 Glendale Ave
- 24 Oakcrest Rd
- 69 Lockwood Rd
- 29 Oakcrest Rd
- 65 Lockwood Rd
- 20 Oakcrest Rd
- 61 Lockwood Rd
- 77 Lockwood Rd
- 25 Oakcrest Rd
- 21 Oakcrest Rd
- 14 Oakcrest Rd
- 14 Oakcrest Rd Unit 1
- 55 Lockwood Rd
- 17 Oakcrest Rd
- 17 0akcrest Rd
- 62 Lockwood Rd
- 72 Lockwood Rd
- 83 Lockwood Rd
- 10 Oakcrest Rd
- 78 Lockwood Rd
- 56 Lockwood Rd