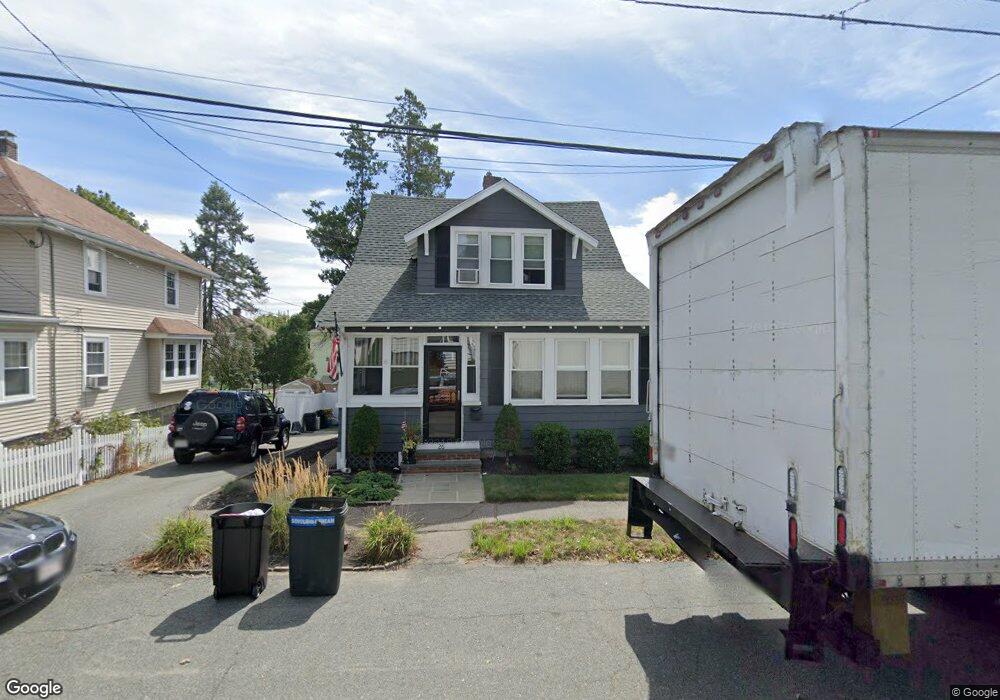
26 Oakland Ave Quincy, MA 02170
Quincy Center NeighborhoodEstimated Value: $682,000 - $754,633
4
Beds
2
Baths
1,684
Sq Ft
$435/Sq Ft
Est. Value
About This Home
This home is located at 26 Oakland Ave, Quincy, MA 02170 and is currently estimated at $732,658, approximately $435 per square foot. 26 Oakland Ave is a home located in Norfolk County with nearby schools including Charles A. Bernazzani Elementary School, Central Middle School, and North Quincy High School.
Ownership History
Date
Name
Owned For
Owner Type
Purchase Details
Closed on
Jun 19, 2009
Sold by
Nelson John E and Nelson Mary J
Bought by
Nelson Mary J
Current Estimated Value
Purchase Details
Closed on
Aug 31, 1995
Sold by
Gagnon Claire V
Bought by
Nelson John E and Nelson Mry J
Home Financials for this Owner
Home Financials are based on the most recent Mortgage that was taken out on this home.
Original Mortgage
$154,800
Interest Rate
7.61%
Mortgage Type
Purchase Money Mortgage
Create a Home Valuation Report for This Property
The Home Valuation Report is an in-depth analysis detailing your home's value as well as a comparison with similar homes in the area
Home Values in the Area
Average Home Value in this Area
Purchase History
| Date | Buyer | Sale Price | Title Company |
|---|---|---|---|
| Nelson Mary J | -- | -- | |
| Nelson John E | $172,000 | -- |
Source: Public Records
Mortgage History
| Date | Status | Borrower | Loan Amount |
|---|---|---|---|
| Previous Owner | Nelson John E | $154,800 |
Source: Public Records
Tax History Compared to Growth
Tax History
| Year | Tax Paid | Tax Assessment Tax Assessment Total Assessment is a certain percentage of the fair market value that is determined by local assessors to be the total taxable value of land and additions on the property. | Land | Improvement |
|---|---|---|---|---|
| 2025 | $7,514 | $651,700 | $333,800 | $317,900 |
| 2024 | $7,243 | $642,700 | $333,800 | $308,900 |
| 2023 | $6,754 | $606,800 | $317,900 | $288,900 |
| 2022 | $6,419 | $535,800 | $254,300 | $281,500 |
| 2021 | $6,380 | $525,500 | $254,300 | $271,200 |
| 2020 | $6,485 | $521,700 | $254,300 | $267,400 |
| 2019 | $5,945 | $473,700 | $237,700 | $236,000 |
| 2018 | $5,911 | $443,100 | $216,100 | $227,000 |
| 2017 | $5,953 | $420,100 | $216,100 | $204,000 |
| 2016 | $5,691 | $396,300 | $196,400 | $199,900 |
| 2015 | $5,186 | $355,200 | $178,600 | $176,600 |
| 2014 | $4,832 | $325,200 | $170,100 | $155,100 |
Source: Public Records
Map
Nearby Homes
- 165 Old Colony Ave Unit A
- 57 Willow Ave
- 72 Oakland Ave
- 45 Oval Rd Unit 6
- 129 Grand View Ave
- 111 Warren Ave Unit 1F
- 22 Newton Ave
- 163 Clay St Unit C
- 365 Newport Ave Unit 301
- 89 Puritan Dr
- 45 Marion St
- 1025 Hancock St Unit 12K
- 1025 Hancock St Unit 1K
- 14 Priscilla Ln
- 129 Beale St
- 35 Estabrook Rd
- 312 Adams St
- 276 Belmont St
- 95 Monroe Rd Unit 2L
- 1 Adams St Unit 707