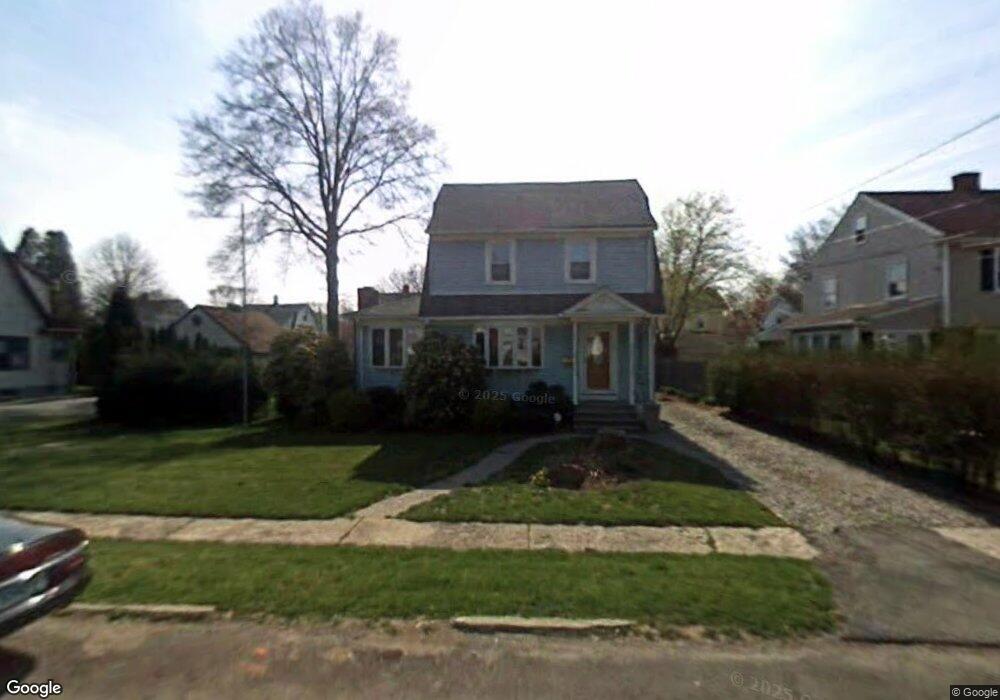
26 Oldroyd St Milford, CT 06461
Devon NeighborhoodEstimated Value: $435,000 - $476,000
3
Beds
2
Baths
1,607
Sq Ft
$282/Sq Ft
Est. Value
About This Home
This home is located at 26 Oldroyd St, Milford, CT 06461 and is currently estimated at $452,813, approximately $281 per square foot. 26 Oldroyd St is a home located in New Haven County with nearby schools including J.F. Kennedy School, West Shore Middle School, and Jonathan Law High School.
Ownership History
Date
Name
Owned For
Owner Type
Purchase Details
Closed on
Jul 1, 1996
Sold by
Cirillo James
Bought by
Tracy Daniel J
Current Estimated Value
Home Financials for this Owner
Home Financials are based on the most recent Mortgage that was taken out on this home.
Original Mortgage
$122,400
Interest Rate
8.05%
Mortgage Type
Unknown
Purchase Details
Closed on
Sep 3, 1993
Sold by
Roberts Ray E and Roberts Suzanne M
Bought by
Cirillo James
Create a Home Valuation Report for This Property
The Home Valuation Report is an in-depth analysis detailing your home's value as well as a comparison with similar homes in the area
Home Values in the Area
Average Home Value in this Area
Purchase History
| Date | Buyer | Sale Price | Title Company |
|---|---|---|---|
| Tracy Daniel J | $136,000 | -- | |
| Tracy Daniel J | $136,000 | -- | |
| Cirillo James | $127,000 | -- | |
| Cirillo James | $127,000 | -- |
Source: Public Records
Mortgage History
| Date | Status | Borrower | Loan Amount |
|---|---|---|---|
| Open | Cirillo James | $139,500 | |
| Closed | Cirillo James | $14,500 | |
| Closed | Cirillo James | $122,400 |
Source: Public Records
Tax History
| Year | Tax Paid | Tax Assessment Tax Assessment Total Assessment is a certain percentage of the fair market value that is determined by local assessors to be the total taxable value of land and additions on the property. | Land | Improvement |
|---|---|---|---|---|
| 2025 | $5,914 | $200,140 | $74,010 | $126,130 |
| 2024 | $5,832 | $200,140 | $74,010 | $126,130 |
| 2023 | $5,438 | $200,140 | $74,010 | $126,130 |
| 2022 | $5,334 | $200,140 | $74,010 | $126,130 |
| 2021 | $4,709 | $170,320 | $56,000 | $114,320 |
| 2020 | $4,714 | $170,320 | $56,000 | $114,320 |
| 2019 | $4,720 | $170,320 | $56,000 | $114,320 |
| 2018 | $4,725 | $170,320 | $56,000 | $114,320 |
| 2017 | $4,733 | $170,320 | $56,000 | $114,320 |
| 2016 | $5,068 | $182,050 | $56,000 | $126,050 |
| 2015 | $5,076 | $182,050 | $56,000 | $126,050 |
| 2014 | $4,955 | $182,050 | $56,000 | $126,050 |
Source: Public Records
Map
Nearby Homes
- 50 Judson Place
- 75 Berwyn St
- 22 Fairview St
- 15 Utica St
- 23 Utica St
- 36 Utica St
- 657 Naugatuck Ave
- 43 Collingsdale Dr
- 221 Meadows End Rd
- 0 Saco St
- 21 Matthews St
- 22 Hollywood Ave
- 24 Matthews St
- 38 Hollywood Ave
- 24 Dewey Ave
- 151 Naugatuck Ave
- 98 Oregon Ave S
- 65 Eastern Pkwy
- 50 Woodhill Rd
- 18 Greenview Ln
Your Personal Tour Guide
Ask me questions while you tour the home.