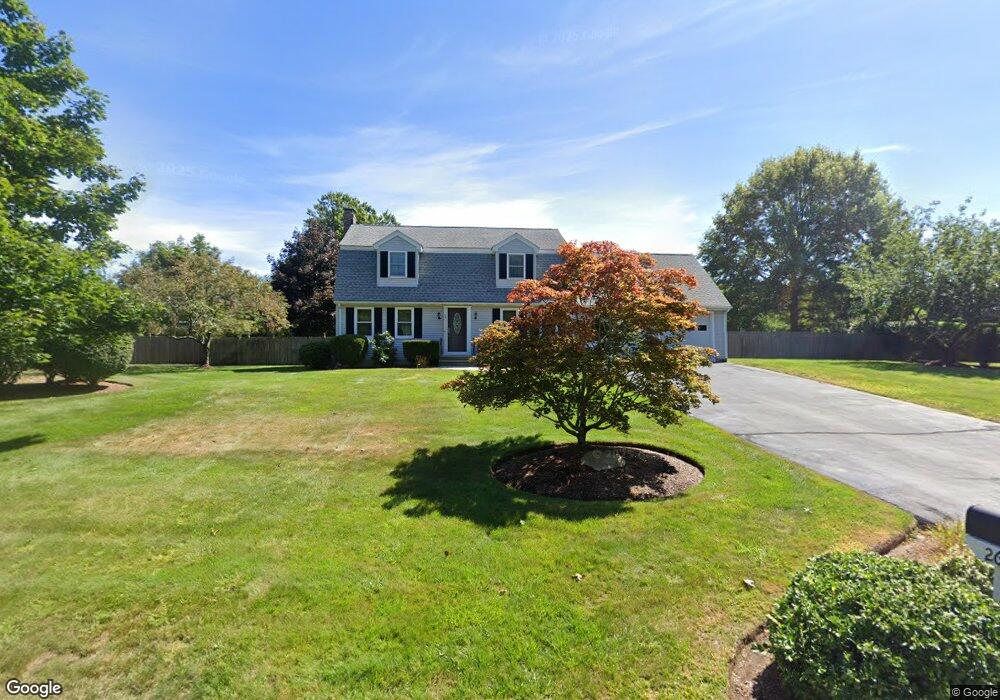
26 Oletree Rd Pembroke, MA 02359
Estimated Value: $728,000 - $809,000
3
Beds
3
Baths
1,872
Sq Ft
$413/Sq Ft
Est. Value
About This Home
This home is located at 26 Oletree Rd, Pembroke, MA 02359 and is currently estimated at $773,088, approximately $412 per square foot. 26 Oletree Rd is a home located in Plymouth County with nearby schools including Pembroke High School.
Ownership History
Date
Name
Owned For
Owner Type
Purchase Details
Closed on
Jun 23, 2025
Sold by
Cachuela Joselito K
Bought by
Joselito K Cachuela Lt and Cachuela
Current Estimated Value
Purchase Details
Closed on
Jun 30, 2004
Sold by
Maxon Charles Todd and Maxon Charles T
Bought by
Cachuela Joselito K
Create a Home Valuation Report for This Property
The Home Valuation Report is an in-depth analysis detailing your home's value as well as a comparison with similar homes in the area
Home Values in the Area
Average Home Value in this Area
Purchase History
| Date | Buyer | Sale Price | Title Company |
|---|---|---|---|
| Joselito K Cachuela Lt | -- | None Available | |
| Joselito K Cachuela Lt | -- | None Available | |
| Cachuela Joselito K | $445,000 | -- | |
| Cachuela Joselito K | $445,000 | -- |
Source: Public Records
Mortgage History
| Date | Status | Borrower | Loan Amount |
|---|---|---|---|
| Previous Owner | Cachuela Joselito K | $300,000 |
Source: Public Records
Tax History Compared to Growth
Tax History
| Year | Tax Paid | Tax Assessment Tax Assessment Total Assessment is a certain percentage of the fair market value that is determined by local assessors to be the total taxable value of land and additions on the property. | Land | Improvement |
|---|---|---|---|---|
| 2025 | $7,877 | $655,300 | $314,600 | $340,700 |
| 2024 | $7,469 | $620,900 | $309,400 | $311,500 |
| 2023 | $7,532 | $592,100 | $294,600 | $297,500 |
| 2022 | $6,742 | $476,500 | $242,200 | $234,300 |
| 2021 | $6,315 | $433,100 | $227,000 | $206,100 |
| 2020 | $6,081 | $419,700 | $222,200 | $197,500 |
| 2019 | $5,971 | $409,000 | $216,500 | $192,500 |
| 2018 | $5,995 | $402,600 | $216,500 | $186,100 |
| 2017 | $5,943 | $393,600 | $206,500 | $187,100 |
| 2016 | $5,797 | $379,900 | $191,700 | $188,200 |
| 2015 | $5,470 | $371,100 | $181,700 | $189,400 |
Source: Public Records
Map
Nearby Homes