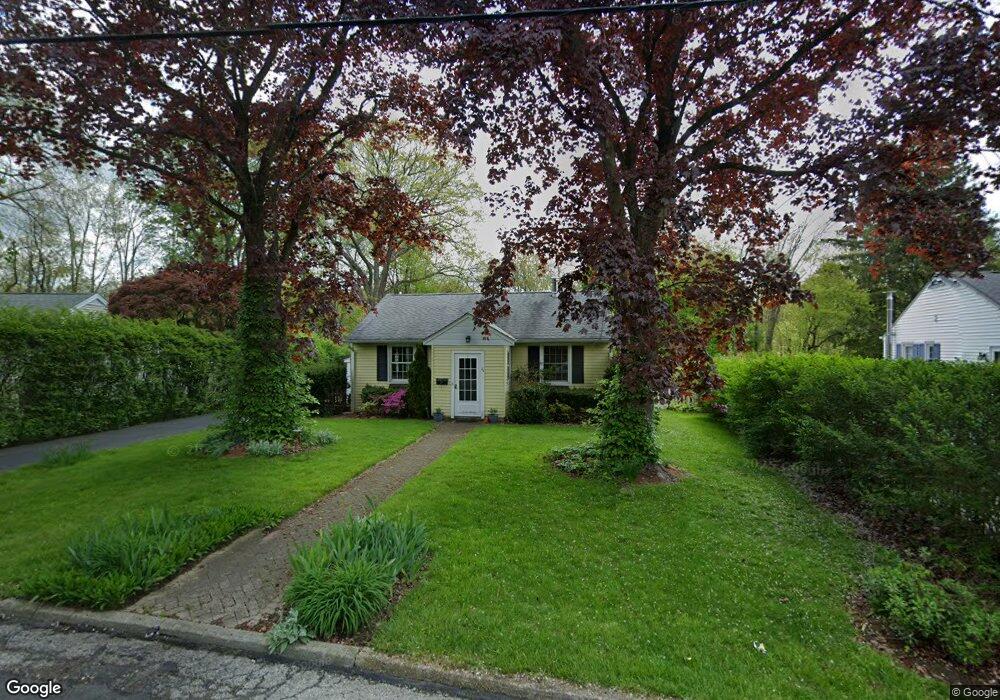
26 Osage Dr E Ossining, NY 10562
Estimated Value: $534,667 - $619,000
2
Beds
1
Bath
1,108
Sq Ft
$514/Sq Ft
Est. Value
About This Home
This home is located at 26 Osage Dr E, Ossining, NY 10562 and is currently estimated at $569,417, approximately $513 per square foot. 26 Osage Dr E is a home located in Westchester County with nearby schools including Park School, Roosevelt Elementary School, and Brookside Elementary School.
Ownership History
Date
Name
Owned For
Owner Type
Purchase Details
Closed on
Sep 8, 2009
Sold by
Ritacco Joseph J and Ritacco Diane G
Bought by
Clemmens Barbara R
Current Estimated Value
Home Financials for this Owner
Home Financials are based on the most recent Mortgage that was taken out on this home.
Original Mortgage
$100,000
Outstanding Balance
$65,233
Interest Rate
5.14%
Mortgage Type
New Conventional
Estimated Equity
$504,184
Create a Home Valuation Report for This Property
The Home Valuation Report is an in-depth analysis detailing your home's value as well as a comparison with similar homes in the area
Home Values in the Area
Average Home Value in this Area
Purchase History
| Date | Buyer | Sale Price | Title Company |
|---|---|---|---|
| Clemmens Barbara R | $339,222 | Chicago Title Insurance Co |
Source: Public Records
Mortgage History
| Date | Status | Borrower | Loan Amount |
|---|---|---|---|
| Open | Clemmens Barbara R | $100,000 |
Source: Public Records
Tax History
| Year | Tax Paid | Tax Assessment Tax Assessment Total Assessment is a certain percentage of the fair market value that is determined by local assessors to be the total taxable value of land and additions on the property. | Land | Improvement |
|---|---|---|---|---|
| 2024 | $13,558 | $477,000 | $180,600 | $296,400 |
| 2023 | $12,594 | $441,900 | $180,600 | $261,300 |
| 2022 | $12,200 | $392,800 | $180,600 | $212,200 |
| 2021 | $10,458 | $350,800 | $180,600 | $170,200 |
| 2020 | $12,717 | $350,800 | $180,600 | $170,200 |
| 2019 | $12,410 | $349,900 | $172,000 | $177,900 |
| 2018 | $12,041 | $339,800 | $172,000 | $167,800 |
| 2017 | $6,582 | $336,400 | $172,000 | $164,400 |
| 2016 | $120,215 | $336,400 | $172,000 | $164,400 |
| 2015 | $7,008 | $18,750 | $5,300 | $13,450 |
| 2014 | $7,008 | $18,750 | $5,300 | $13,450 |
| 2013 | $7,008 | $18,750 | $5,300 | $13,450 |
Source: Public Records
Map
Nearby Homes
Your Personal Tour Guide
Ask me questions while you tour the home.