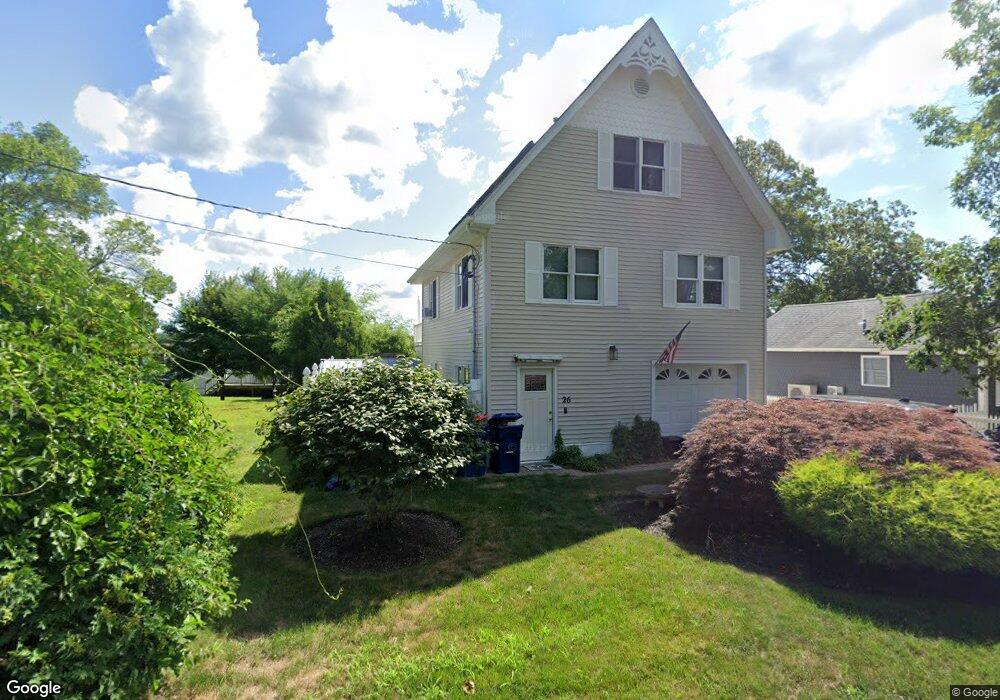
26 Osborne Ave West Wareham, MA 02576
Estimated Value: $444,057 - $524,000
2
Beds
2
Baths
1,080
Sq Ft
$444/Sq Ft
Est. Value
About This Home
This home is located at 26 Osborne Ave, West Wareham, MA 02576 and is currently estimated at $480,014, approximately $444 per square foot. 26 Osborne Ave is a home.
Ownership History
Date
Name
Owned For
Owner Type
Purchase Details
Closed on
Nov 2, 2006
Sold by
Silva Manuel V
Bought by
Silva Manuel V and Silva Marjorie L
Current Estimated Value
Purchase Details
Closed on
Dec 24, 2003
Sold by
Silva Manuel V
Bought by
Silva Manuel V
Purchase Details
Closed on
Mar 21, 2003
Sold by
Bairos Antonio S
Bought by
Avenue Silva Manuel V and 69 Barlow Avenue
Purchase Details
Closed on
Aug 3, 2000
Sold by
Lewis Richard M
Bought by
Ale Rt
Purchase Details
Closed on
Jun 1, 1998
Sold by
Mcmanus J John
Bought by
Legal Rt and Goldrick Daniel E
Create a Home Valuation Report for This Property
The Home Valuation Report is an in-depth analysis detailing your home's value as well as a comparison with similar homes in the area
Home Values in the Area
Average Home Value in this Area
Purchase History
| Date | Buyer | Sale Price | Title Company |
|---|---|---|---|
| Silva Manuel V | -- | -- | |
| Silva Manuel V | -- | -- | |
| Silva Manuel V | -- | -- | |
| Silva Manuel V | -- | -- | |
| Avenue Silva Manuel V | $275,000 | -- | |
| Silva Manuel V | $275,000 | -- | |
| Ale Rt | $25,000 | -- | |
| Ale Rt | $25,000 | -- | |
| Legal Rt | $1,000 | -- |
Source: Public Records
Mortgage History
| Date | Status | Borrower | Loan Amount |
|---|---|---|---|
| Open | Legal Rt | $250,000 | |
| Previous Owner | Legal Rt | $304,863 |
Source: Public Records
Tax History Compared to Growth
Tax History
| Year | Tax Paid | Tax Assessment Tax Assessment Total Assessment is a certain percentage of the fair market value that is determined by local assessors to be the total taxable value of land and additions on the property. | Land | Improvement |
|---|---|---|---|---|
| 2025 | $4,303 | $413,000 | $117,800 | $295,200 |
| 2024 | $4,495 | $400,300 | $91,300 | $309,000 |
| 2023 | $3,942 | $360,400 | $78,900 | $281,500 |
| 2022 | $3,942 | $299,100 | $78,900 | $220,200 |
| 2021 | $3,610 | $268,400 | $78,900 | $189,500 |
| 2020 | $3,453 | $260,400 | $78,900 | $181,500 |
| 2019 | $3,404 | $256,100 | $74,200 | $181,900 |
| 2018 | $3,123 | $229,100 | $74,200 | $154,900 |
| 2017 | $3,081 | $229,100 | $74,200 | $154,900 |
| 2016 | $2,830 | $209,200 | $71,100 | $138,100 |
| 2015 | $2,691 | $205,900 | $71,100 | $134,800 |
| 2014 | $2,525 | $196,500 | $66,600 | $129,900 |
Source: Public Records
Map
Nearby Homes
- 12 Taft St
- 26 Washington Dr
- 929 Point Rd
- 21 Windsor Dr
- 174 Wareham Rd
- 0 Cromesett Rd (Off) Unit 73385395
- 4 Rebecca Dr
- 5 Sola's Cir
- 58 Shady Ln
- 6 A Rock Marsh Rd Unit A
- 6 A Rock Marsh Rd Unit A
- Lot 77E Seahorse
- Lot 77D Seahorse
- 233 Marion Rd
- 7 Seahorse Way
- 245 Wareham Rd
- 21 Weston Ave
- 119 County Rd
- 4 Blackhall Ct
- 127 County Rd