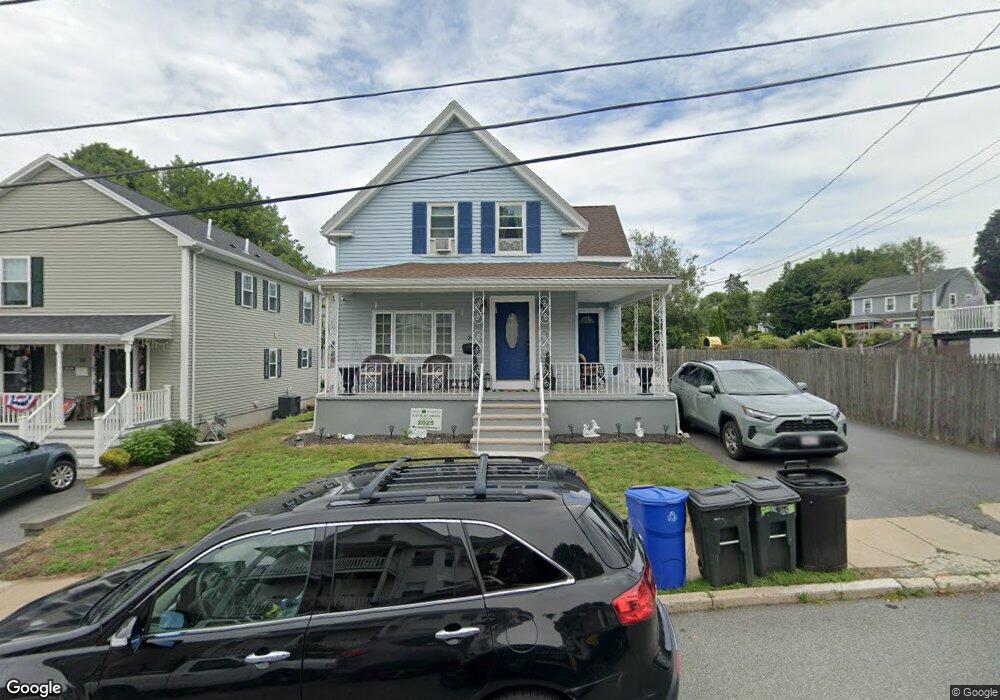
26 Osborne St Peabody, MA 01960
Peabody Town Center NeighborhoodEstimated Value: $559,104 - $686,000
4
Beds
2
Baths
1,320
Sq Ft
$457/Sq Ft
Est. Value
About This Home
This home is located at 26 Osborne St, Peabody, MA 01960 and is currently estimated at $603,276, approximately $457 per square foot. 26 Osborne St is a home located in Essex County with nearby schools including Peabody Veterans Memorial High School, St John The Baptist School, and The Phoenix School.
Ownership History
Date
Name
Owned For
Owner Type
Purchase Details
Closed on
Jun 13, 2005
Sold by
Oliveira Manuel A and Oliveira Rosa F
Bought by
Carrero Aura A
Current Estimated Value
Home Financials for this Owner
Home Financials are based on the most recent Mortgage that was taken out on this home.
Original Mortgage
$249,600
Interest Rate
5.79%
Mortgage Type
Purchase Money Mortgage
Purchase Details
Closed on
Oct 31, 1994
Sold by
Griffin Harold R and Griffin Agnes M
Bought by
Trainer Joseph M
Create a Home Valuation Report for This Property
The Home Valuation Report is an in-depth analysis detailing your home's value as well as a comparison with similar homes in the area
Home Values in the Area
Average Home Value in this Area
Purchase History
| Date | Buyer | Sale Price | Title Company |
|---|---|---|---|
| Carrero Aura A | $312,000 | -- | |
| Trainer Joseph M | $124,000 | -- |
Source: Public Records
Mortgage History
| Date | Status | Borrower | Loan Amount |
|---|---|---|---|
| Open | Trainer Joseph M | $314,000 | |
| Closed | Trainer Joseph M | $249,600 |
Source: Public Records
Tax History Compared to Growth
Tax History
| Year | Tax Paid | Tax Assessment Tax Assessment Total Assessment is a certain percentage of the fair market value that is determined by local assessors to be the total taxable value of land and additions on the property. | Land | Improvement |
|---|---|---|---|---|
| 2025 | $4,026 | $434,800 | $201,400 | $233,400 |
| 2024 | $3,955 | $433,700 | $201,400 | $232,300 |
| 2023 | $3,769 | $395,900 | $175,200 | $220,700 |
| 2022 | $3,420 | $338,600 | $156,400 | $182,200 |
| 2021 | $3,541 | $337,600 | $142,200 | $195,400 |
| 2020 | $3,312 | $308,400 | $142,200 | $166,200 |
| 2019 | $3,236 | $293,900 | $142,200 | $151,700 |
| 2018 | $3,119 | $272,200 | $134,100 | $138,100 |
| 2017 | $3,021 | $256,900 | $134,100 | $122,800 |
| 2016 | $2,740 | $229,900 | $134,100 | $95,800 |
| 2015 | $2,847 | $231,500 | $134,100 | $97,400 |
Source: Public Records
Map
Nearby Homes
- 2 Osborne St
- 9 Sutton St
- 46 Sutton St
- 13 State St
- 36 Summit St
- 15 Wall St
- 176 Marlborough Rd
- 55 Butler St
- 10 Elliott Place Unit 1R
- 39 Gallows Hill Rd
- 145 Boston St
- 159 Marlborough Rd
- 128 Boston St Unit 4
- 111 Foster St Unit 401
- 111 Foster St Unit 416
- 25 Outlook Ave
- 46 Walnut St
- 38 Valley St
- 36 Valley St
- 8 Walnut St Unit 209
- 24 Osborne St
- 7 Charlotte St
- 22 Osborne St
- 71 Pierpont St
- 71 Pierpont St Unit 2
- 71 Pierpont St Unit 1
- 73 Pierpont St
- 23 Osborne St
- 23 Osborne St Unit A
- 71 Pierpont St
- 25 Osborne St
- 25 Osborne St Unit 2
- 39 Osborne St
- 69 Pierpont St
- 20 Osborne St
- 41 Osborne St
- 8 Charlotte St
- 21 Osborne St
- 63 Pierpont St
- 6 Charlotte St