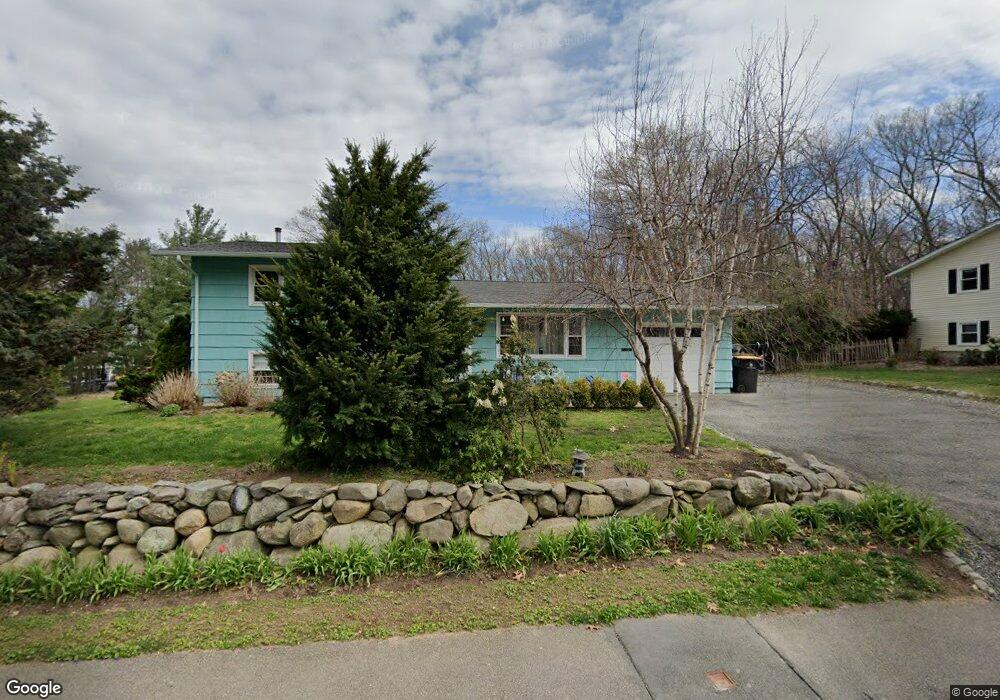
26 Pamela Rd Framingham, MA 01701
Nobscot NeighborhoodEstimated Value: $662,000 - $737,000
3
Beds
3
Baths
1,779
Sq Ft
$388/Sq Ft
Est. Value
About This Home
This home is located at 26 Pamela Rd, Framingham, MA 01701 and is currently estimated at $689,485, approximately $387 per square foot. 26 Pamela Rd is a home located in Middlesex County with nearby schools including Framingham High School and MetroWest Jewish Day School.
Ownership History
Date
Name
Owned For
Owner Type
Purchase Details
Closed on
Aug 14, 2006
Sold by
Ambrosone Mark C
Bought by
Faulk Joann S and Faulk Jolyon W
Current Estimated Value
Home Financials for this Owner
Home Financials are based on the most recent Mortgage that was taken out on this home.
Original Mortgage
$307,600
Outstanding Balance
$185,079
Interest Rate
6.8%
Mortgage Type
Purchase Money Mortgage
Estimated Equity
$504,406
Purchase Details
Closed on
Oct 3, 1994
Sold by
Belli Bruna
Bought by
Ambrosone Mark C
Home Financials for this Owner
Home Financials are based on the most recent Mortgage that was taken out on this home.
Original Mortgage
$172,500
Interest Rate
8.5%
Mortgage Type
Purchase Money Mortgage
Create a Home Valuation Report for This Property
The Home Valuation Report is an in-depth analysis detailing your home's value as well as a comparison with similar homes in the area
Home Values in the Area
Average Home Value in this Area
Purchase History
We collect this data history from publicly available records. To have your information removed, we recommend requesting removal directly through your county’s website.
| Date | Buyer | Sale Price | Title Company |
|---|---|---|---|
| Faulk Joann S | $384,500 | -- | |
| Faulk Joann S | $384,500 | -- | |
| Ambrosone Mark C | $185,000 | -- | |
| Ambrosone Mark C | $185,000 | -- |
Source: Public Records
Mortgage History
We collect this data history from publicly available records. To have your information removed, we recommend requesting removal directly through your county’s website.
| Date | Status | Borrower | Loan Amount |
|---|---|---|---|
| Open | Faulk Joann S | $307,600 | |
| Closed | Ambrosone Mark C | $307,600 | |
| Previous Owner | Ambrosone Mark C | $172,500 |
Source: Public Records
Tax History
| Year | Tax Paid | Tax Assessment Tax Assessment Total Assessment is a certain percentage of the fair market value that is determined by local assessors to be the total taxable value of land and additions on the property. | Land | Improvement |
|---|---|---|---|---|
| 2025 | $7,090 | $593,800 | $276,600 | $317,200 |
| 2024 | $6,767 | $543,100 | $247,000 | $296,100 |
| 2023 | $6,367 | $486,400 | $220,500 | $265,900 |
| 2022 | $6,010 | $437,400 | $200,100 | $237,300 |
| 2021 | $5,869 | $417,700 | $192,300 | $225,400 |
| 2020 | $5,869 | $391,800 | $174,700 | $217,100 |
| 2019 | $5,815 | $378,100 | $174,700 | $203,400 |
| 2018 | $5,719 | $350,400 | $168,200 | $182,200 |
| 2017 | $5,561 | $332,800 | $163,300 | $169,500 |
| 2016 | $5,430 | $312,400 | $163,300 | $149,100 |
| 2015 | $5,341 | $299,700 | $163,100 | $136,600 |
Source: Public Records
Map
Nearby Homes
- 915 Edgell Rd Unit 61
- 62 Hemenway Rd
- 94 Spruce St
- 350 Central St
- 15 Fenway Dr
- 7 Edith Rd
- 65 Florita Dr
- 477 Edgell Rd
- 30 Elda Rd
- 83 Nicholas Rd Unit D
- 47 Indian Head Rd
- 88 Elm St
- 1239 Edgell Rd
- 24 Chestnut St Unit 2
- 19 Chestnut St
- 301 Winch St
- 70 Harrington Rd
- 576 Grove St
- 22 Leonard Rd
- 7 Ballydrain Rd
Your Personal Tour Guide
Ask me questions while you tour the home.