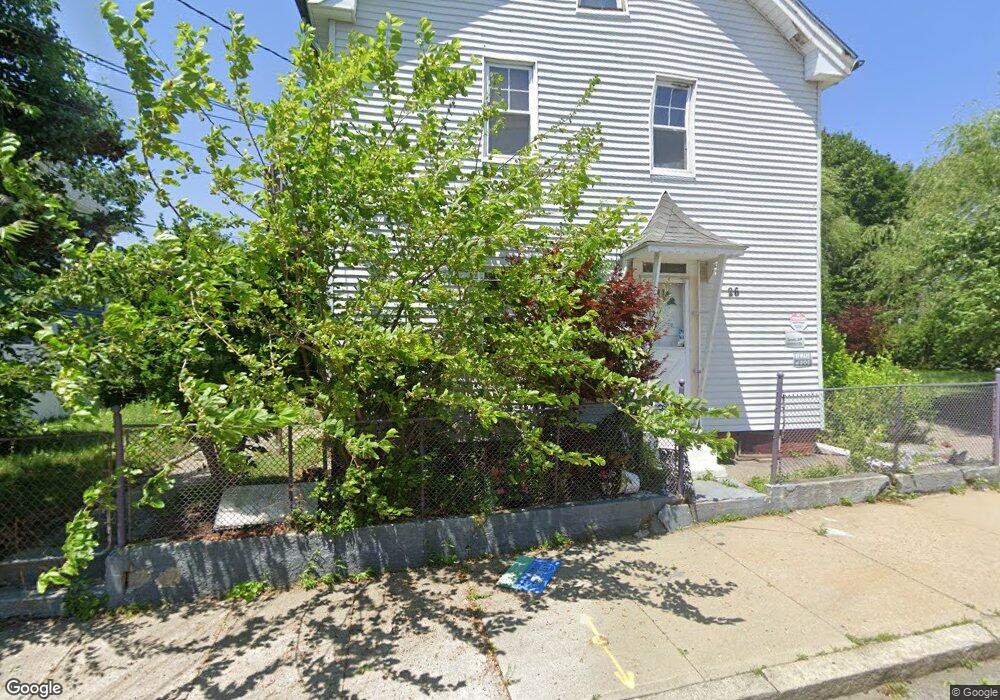
26 Peter St Providence, RI 02904
Charles NeighborhoodEstimated Value: $389,675 - $531,000
4
Beds
2
Baths
1,794
Sq Ft
$264/Sq Ft
Est. Value
About This Home
This home is located at 26 Peter St, Providence, RI 02904 and is currently estimated at $472,919, approximately $263 per square foot. 26 Peter St is a home located in Providence County with nearby schools including Times Squared Academy, Times2 Elementary School, and Times2 Middle/High School.
Ownership History
Date
Name
Owned For
Owner Type
Purchase Details
Closed on
Oct 10, 2003
Sold by
Medeiros Beverly A
Bought by
Aldana Mario
Current Estimated Value
Home Financials for this Owner
Home Financials are based on the most recent Mortgage that was taken out on this home.
Original Mortgage
$185,250
Interest Rate
6.35%
Mortgage Type
Purchase Money Mortgage
Create a Home Valuation Report for This Property
The Home Valuation Report is an in-depth analysis detailing your home's value as well as a comparison with similar homes in the area
Home Values in the Area
Average Home Value in this Area
Purchase History
| Date | Buyer | Sale Price | Title Company |
|---|---|---|---|
| Aldana Mario | $195,000 | -- |
Source: Public Records
Mortgage History
| Date | Status | Borrower | Loan Amount |
|---|---|---|---|
| Open | Aldana Mario | $220,000 | |
| Closed | Aldana Mario | $185,250 | |
| Previous Owner | Aldana Mario | $90,000 | |
| Previous Owner | Aldana Mario | $108,000 |
Source: Public Records
Tax History
| Year | Tax Paid | Tax Assessment Tax Assessment Total Assessment is a certain percentage of the fair market value that is determined by local assessors to be the total taxable value of land and additions on the property. | Land | Improvement |
|---|---|---|---|---|
| 2025 | $3,034 | $401,800 | $129,600 | $272,200 |
| 2024 | $4,762 | $259,500 | $68,900 | $190,600 |
| 2023 | $4,762 | $259,500 | $68,900 | $190,600 |
| 2022 | $4,619 | $259,500 | $68,900 | $190,600 |
| 2021 | $4,396 | $179,000 | $64,400 | $114,600 |
| 2020 | $4,396 | $179,000 | $64,400 | $114,600 |
| 2019 | $4,396 | $179,000 | $64,400 | $114,600 |
| 2018 | $3,787 | $118,500 | $49,700 | $68,800 |
| 2017 | $3,787 | $118,500 | $49,700 | $68,800 |
| 2016 | $3,787 | $118,500 | $49,700 | $68,800 |
| 2015 | $3,624 | $109,500 | $52,700 | $56,800 |
| 2014 | $3,696 | $109,500 | $52,700 | $56,800 |
| 2013 | $3,696 | $109,500 | $52,700 | $56,800 |
Source: Public Records
Map
Nearby Homes
Your Personal Tour Guide
Ask me questions while you tour the home.