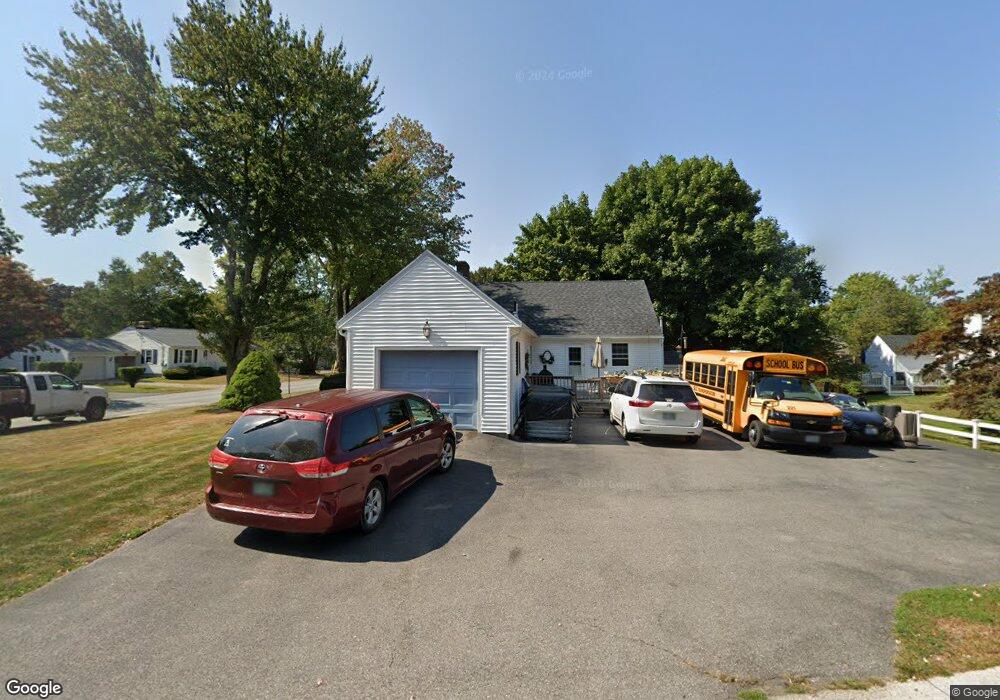
26 Philbrook Terrace Hampton, NH 03842
Estimated Value: $671,000 - $860,000
4
Beds
2
Baths
2,082
Sq Ft
$349/Sq Ft
Est. Value
About This Home
This home is located at 26 Philbrook Terrace, Hampton, NH 03842 and is currently estimated at $727,117, approximately $349 per square foot. 26 Philbrook Terrace is a home located in Rockingham County with nearby schools including Hampton Centre School, Adeline C. Marston Elementary School, and Hampton Academy.
Ownership History
Date
Name
Owned For
Owner Type
Purchase Details
Closed on
Sep 12, 2020
Sold by
Marston Melissa H and Cook June H
Bought by
Marston Timothy J and Marston Melissa H
Current Estimated Value
Home Financials for this Owner
Home Financials are based on the most recent Mortgage that was taken out on this home.
Original Mortgage
$178,000
Outstanding Balance
$157,244
Interest Rate
2.9%
Mortgage Type
New Conventional
Estimated Equity
$569,873
Create a Home Valuation Report for This Property
The Home Valuation Report is an in-depth analysis detailing your home's value as well as a comparison with similar homes in the area
Home Values in the Area
Average Home Value in this Area
Purchase History
| Date | Buyer | Sale Price | Title Company |
|---|---|---|---|
| Marston Timothy J | -- | None Available | |
| Marston Timothy J | -- | None Available |
Source: Public Records
Mortgage History
| Date | Status | Borrower | Loan Amount |
|---|---|---|---|
| Open | Marston Timothy J | $178,000 | |
| Closed | Marston Timothy J | $178,000 |
Source: Public Records
Tax History Compared to Growth
Tax History
| Year | Tax Paid | Tax Assessment Tax Assessment Total Assessment is a certain percentage of the fair market value that is determined by local assessors to be the total taxable value of land and additions on the property. | Land | Improvement |
|---|---|---|---|---|
| 2024 | $6,738 | $546,900 | $230,000 | $316,900 |
| 2023 | $6,467 | $386,100 | $153,300 | $232,800 |
| 2022 | $6,116 | $386,100 | $153,300 | $232,800 |
| 2021 | $6,116 | $386,100 | $153,300 | $232,800 |
| 2020 | $6,143 | $385,600 | $153,300 | $232,300 |
| 2019 | $6,173 | $385,600 | $153,300 | $232,300 |
| 2018 | $5,959 | $350,100 | $139,400 | $210,700 |
| 2017 | $5,731 | $350,100 | $139,400 | $210,700 |
| 2016 | $5,630 | $350,100 | $139,400 | $210,700 |
Source: Public Records
Map
Nearby Homes