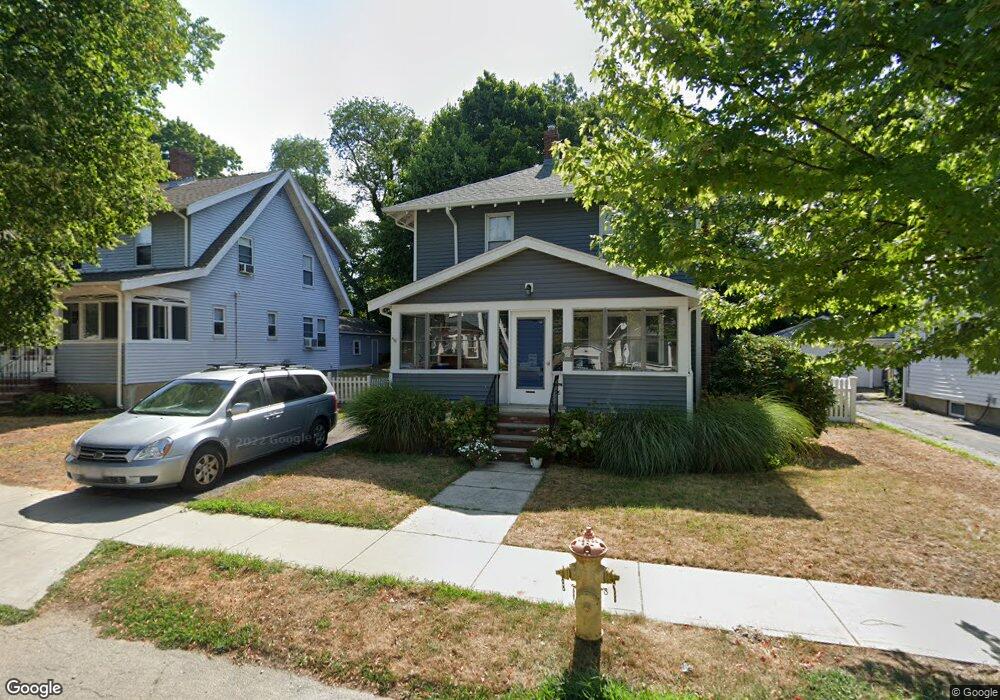
26 Pilgrim Rd Quincy, MA 02169
Estimated Value: $737,000 - $851,000
3
Beds
2
Baths
1,595
Sq Ft
$501/Sq Ft
Est. Value
About This Home
This home is located at 26 Pilgrim Rd, Quincy, MA 02169 and is currently estimated at $799,499, approximately $501 per square foot. 26 Pilgrim Rd is a home located in Norfolk County with nearby schools including Montclair Elementary School, Atlantic Middle School, and North Quincy High School.
Ownership History
Date
Name
Owned For
Owner Type
Purchase Details
Closed on
Apr 27, 1999
Sold by
Hiltz Tr Anne T
Bought by
Roper Sean F and Roper Kristen M
Current Estimated Value
Create a Home Valuation Report for This Property
The Home Valuation Report is an in-depth analysis detailing your home's value as well as a comparison with similar homes in the area
Home Values in the Area
Average Home Value in this Area
Purchase History
| Date | Buyer | Sale Price | Title Company |
|---|---|---|---|
| Roper Sean F | $191,500 | -- |
Source: Public Records
Mortgage History
| Date | Status | Borrower | Loan Amount |
|---|---|---|---|
| Open | Roper Sean F | $215,000 | |
| Closed | Roper Sean F | $221,000 | |
| Closed | Roper Sean F | $177,000 |
Source: Public Records
Tax History Compared to Growth
Tax History
| Year | Tax Paid | Tax Assessment Tax Assessment Total Assessment is a certain percentage of the fair market value that is determined by local assessors to be the total taxable value of land and additions on the property. | Land | Improvement |
|---|---|---|---|---|
| 2025 | $8,277 | $717,900 | $269,900 | $448,000 |
| 2024 | $7,846 | $696,200 | $257,000 | $439,200 |
| 2023 | $7,292 | $655,200 | $244,800 | $410,400 |
| 2022 | $7,015 | $585,600 | $195,800 | $389,800 |
| 2021 | $6,630 | $546,100 | $195,800 | $350,300 |
| 2020 | $5,182 | $416,900 | $195,800 | $221,100 |
| 2019 | $5,040 | $401,600 | $190,100 | $211,500 |
| 2018 | $4,966 | $372,300 | $176,000 | $196,300 |
| 2017 | $4,730 | $333,800 | $167,600 | $166,200 |
| 2016 | $4,434 | $308,800 | $152,400 | $156,400 |
| 2015 | $4,199 | $287,600 | $143,800 | $143,800 |
| 2014 | $4,066 | $273,600 | $143,800 | $129,800 |
Source: Public Records
Map
Nearby Homes
- 41 Wallace Rd
- 60 Pond St
- 11 Rockwell Ave
- 171 Milton St
- 10 White St
- 73 Connell St
- 66 Unity St
- 121 Hillside Ave
- 169 Pine St
- 129-131 Pine St
- 64 Shawmut St
- 51 Denmark Ave
- 111 Shawmut St
- 29 Oconnell Ave
- 397 Adams St
- 400 Adams St Unit A
- 400 Adams St Unit B
- 55 Christopher Dr
- 46 Century Ln
- 639 Pleasant St Unit 639