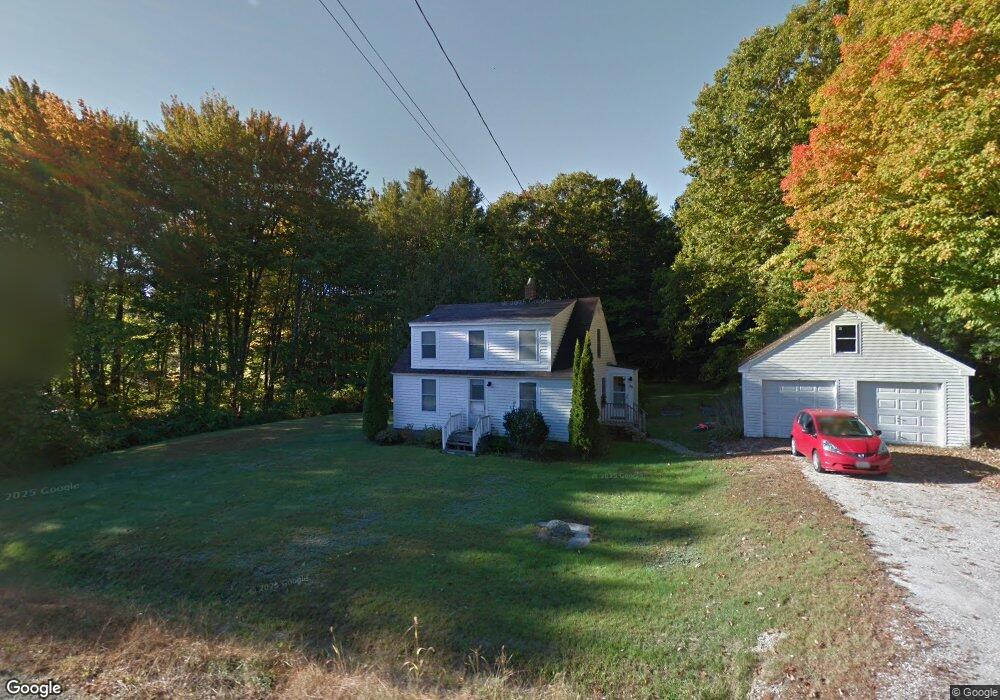
26 Pine St Freeport, ME 04032
Estimated Value: $403,000 - $564,000
3
Beds
1
Bath
1,142
Sq Ft
$418/Sq Ft
Est. Value
About This Home
This home is located at 26 Pine St, Freeport, ME 04032 and is currently estimated at $477,000, approximately $417 per square foot. 26 Pine St is a home located in Cumberland County with nearby schools including Morse Street School, Mast Landing School, and Freeport Middle School.
Ownership History
Date
Name
Owned For
Owner Type
Purchase Details
Closed on
Dec 10, 2024
Sold by
Walker Corey S
Bought by
Dawson Sarah and Walker Corey S
Current Estimated Value
Home Financials for this Owner
Home Financials are based on the most recent Mortgage that was taken out on this home.
Original Mortgage
$728,747
Outstanding Balance
$721,607
Interest Rate
6.72%
Mortgage Type
Purchase Money Mortgage
Estimated Equity
-$244,607
Purchase Details
Closed on
Jun 6, 2017
Sold by
Yilmaz Family Llc
Bought by
Walker Corey S
Home Financials for this Owner
Home Financials are based on the most recent Mortgage that was taken out on this home.
Original Mortgage
$210,000
Interest Rate
3.97%
Mortgage Type
New Conventional
Purchase Details
Closed on
Jun 28, 2005
Sold by
Brewer Herbert E and Brewer Janice E
Bought by
Yilmaz Family Llc
Create a Home Valuation Report for This Property
The Home Valuation Report is an in-depth analysis detailing your home's value as well as a comparison with similar homes in the area
Home Values in the Area
Average Home Value in this Area
Purchase History
| Date | Buyer | Sale Price | Title Company |
|---|---|---|---|
| Dawson Sarah | -- | None Available | |
| Dawson Sarah | -- | None Available | |
| Walker Corey S | -- | -- | |
| Yilmaz Family Llc | -- | -- | |
| Walker Corey S | -- | -- | |
| Yilmaz Family Llc | -- | -- |
Source: Public Records
Mortgage History
| Date | Status | Borrower | Loan Amount |
|---|---|---|---|
| Open | Dawson Sarah | $728,747 | |
| Closed | Dawson Sarah | $728,747 | |
| Previous Owner | Walker Corey S | $210,000 |
Source: Public Records
Tax History Compared to Growth
Tax History
| Year | Tax Paid | Tax Assessment Tax Assessment Total Assessment is a certain percentage of the fair market value that is determined by local assessors to be the total taxable value of land and additions on the property. | Land | Improvement |
|---|---|---|---|---|
| 2024 | $3,713 | $278,100 | $162,000 | $116,100 |
| 2023 | $3,420 | $248,700 | $147,200 | $101,500 |
| 2022 | $3,187 | $233,500 | $132,000 | $101,500 |
| 2021 | $3,117 | $233,500 | $132,000 | $101,500 |
| 2020 | $3,000 | $214,300 | $122,200 | $92,100 |
| 2019 | $2,876 | $201,100 | $115,300 | $85,800 |
| 2018 | $2,817 | $187,200 | $107,800 | $79,400 |
| 2017 | $2,707 | $181,100 | $105,300 | $75,800 |
| 2016 | $2,650 | $167,700 | $97,500 | $70,200 |
| 2015 | $2,599 | $154,700 | $92,400 | $62,300 |
| 2014 | $2,455 | $155,400 | $92,400 | $63,000 |
| 2013 | $2,512 | $158,500 | $91,900 | $66,600 |
Source: Public Records
Map
Nearby Homes
- 26 Harvest Ridge Rd Unit 24
- 1612 U S Route 1
- 15 Percy St
- 10 Durham Rd
- 31 Sequoia Dr
- 212 Main St
- 15 Sequoia Dr
- 11 Orchard Hill Rd
- 42 Durham Rd
- 304 Pownal Rd
- 71 Merganser Way
- 241 Bluff Rd Unit 4
- 8 Statler Ln
- 203 Bluff Rd Unit 13
- 393 E Main St
- 1260 Us Route 1
- 15 Tinkers Way
- 247 Ledge Rd
- 162 Merrill Rd
- 4 Harper's Trail