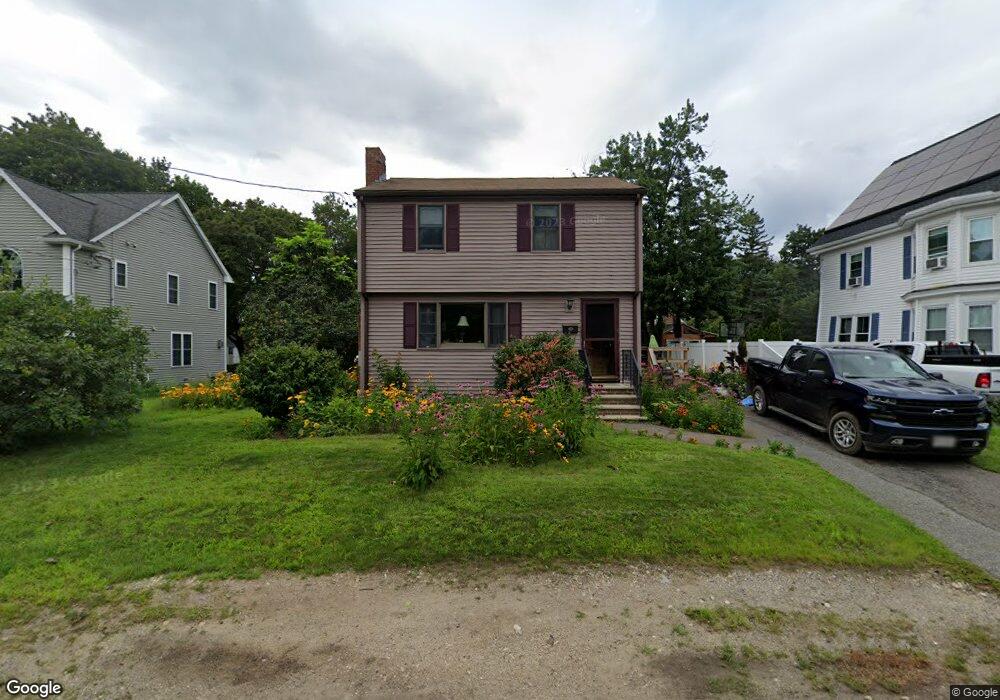
26 Poole St Unit R Woburn, MA 01801
North Woburn NeighborhoodEstimated Value: $672,060 - $727,000
3
Beds
1
Bath
1,469
Sq Ft
$477/Sq Ft
Est. Value
About This Home
This home is located at 26 Poole St Unit R, Woburn, MA 01801 and is currently estimated at $700,765, approximately $477 per square foot. 26 Poole St Unit R is a home located in Middlesex County with nearby schools including Linscott-Rumford Elementary School, John F. Kennedy Middle School, and Woburn High School.
Ownership History
Date
Name
Owned For
Owner Type
Purchase Details
Closed on
Feb 11, 2021
Sold by
Doane Julie A
Bought by
Doane Karl E
Current Estimated Value
Home Financials for this Owner
Home Financials are based on the most recent Mortgage that was taken out on this home.
Original Mortgage
$360,000
Outstanding Balance
$320,507
Interest Rate
2.7%
Mortgage Type
New Conventional
Estimated Equity
$380,258
Purchase Details
Closed on
Jul 17, 1998
Sold by
Murray Ethel C Est and Murray
Bought by
Doane Karl E and Doane Julie A
Home Financials for this Owner
Home Financials are based on the most recent Mortgage that was taken out on this home.
Original Mortgage
$155,000
Interest Rate
6.98%
Mortgage Type
Purchase Money Mortgage
Create a Home Valuation Report for This Property
The Home Valuation Report is an in-depth analysis detailing your home's value as well as a comparison with similar homes in the area
Home Values in the Area
Average Home Value in this Area
Purchase History
| Date | Buyer | Sale Price | Title Company |
|---|---|---|---|
| Doane Karl E | -- | None Available | |
| Doane Karl E | -- | None Available | |
| Doane Karl E | $165,000 | -- | |
| Doane Karl E | $165,000 | -- |
Source: Public Records
Mortgage History
| Date | Status | Borrower | Loan Amount |
|---|---|---|---|
| Open | Doane Karl E | $360,000 | |
| Closed | Doane Karl E | $360,000 | |
| Previous Owner | Doane Karl E | $165,000 | |
| Previous Owner | Doane Karl E | $155,000 |
Source: Public Records
Tax History Compared to Growth
Tax History
| Year | Tax Paid | Tax Assessment Tax Assessment Total Assessment is a certain percentage of the fair market value that is determined by local assessors to be the total taxable value of land and additions on the property. | Land | Improvement |
|---|---|---|---|---|
| 2025 | $5,098 | $596,900 | $335,300 | $261,600 |
| 2024 | $4,579 | $568,100 | $319,300 | $248,800 |
| 2023 | $4,487 | $515,700 | $290,300 | $225,400 |
| 2022 | $4,333 | $463,900 | $252,500 | $211,400 |
| 2021 | $4,086 | $437,900 | $240,500 | $197,400 |
| 2020 | $3,907 | $419,200 | $240,500 | $178,700 |
| 2019 | $3,810 | $401,100 | $229,100 | $172,000 |
| 2018 | $3,692 | $373,300 | $210,200 | $163,100 |
| 2017 | $3,462 | $348,300 | $200,300 | $148,000 |
| 2016 | $3,298 | $328,200 | $187,200 | $141,000 |
| 2015 | $3,167 | $311,400 | $175,000 | $136,400 |
| 2014 | $2,985 | $285,900 | $175,000 | $110,900 |
Source: Public Records
Map
Nearby Homes