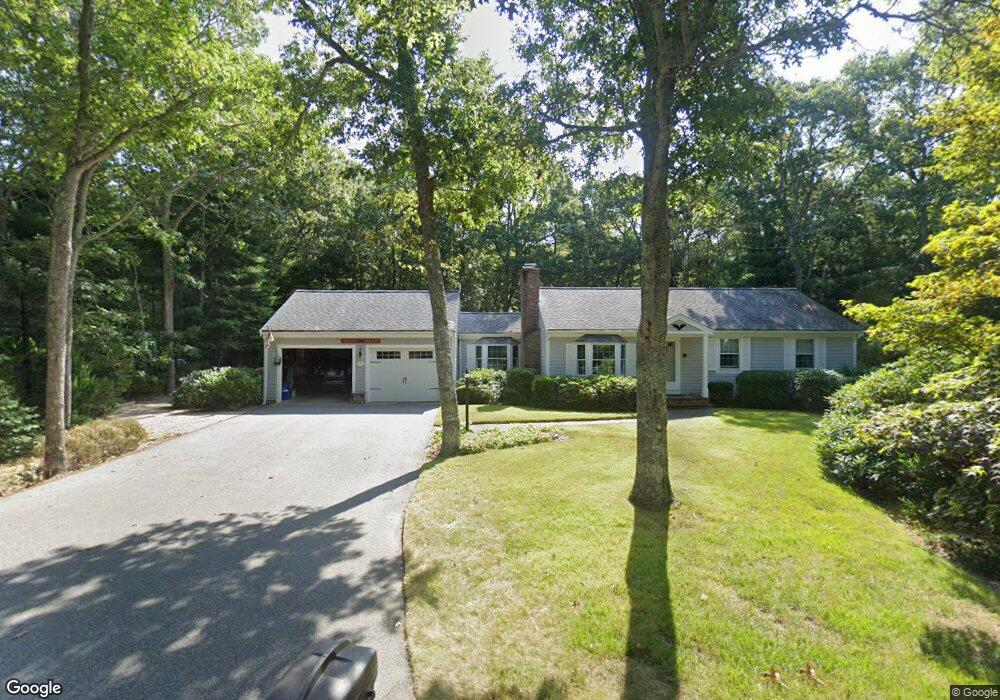
26 Quashnet Way East Falmouth, MA 02536
Waquoit NeighborhoodEstimated Value: $713,376 - $858,000
4
Beds
3
Baths
1,776
Sq Ft
$439/Sq Ft
Est. Value
About This Home
This home is located at 26 Quashnet Way, East Falmouth, MA 02536 and is currently estimated at $779,344, approximately $438 per square foot. 26 Quashnet Way is a home located in Barnstable County with nearby schools including East Falmouth Elementary School, Morse Pond School, and Lawrence School.
Ownership History
Date
Name
Owned For
Owner Type
Purchase Details
Closed on
Jul 12, 2017
Sold by
Ostrom John C
Bought by
John C Ostrom T C and John Ostrom
Current Estimated Value
Purchase Details
Closed on
Aug 10, 2011
Sold by
Ostrom Ft and Ostrom
Bought by
John C Ostrom T C and John Ostrom
Purchase Details
Closed on
Nov 10, 2004
Sold by
Ostrom Dorothy M and Ostrom John C
Bought by
Ostrom Dorothy M and Ostrom John C
Purchase Details
Closed on
Feb 11, 1982
Bought by
John C Ostrom T
Create a Home Valuation Report for This Property
The Home Valuation Report is an in-depth analysis detailing your home's value as well as a comparison with similar homes in the area
Home Values in the Area
Average Home Value in this Area
Purchase History
| Date | Buyer | Sale Price | Title Company |
|---|---|---|---|
| John C Ostrom T C | -- | -- | |
| John C Ostrom T C | -- | -- | |
| Ostrom Dorothy M | -- | -- | |
| John C Ostrom T | $16,000 | -- |
Source: Public Records
Tax History Compared to Growth
Tax History
| Year | Tax Paid | Tax Assessment Tax Assessment Total Assessment is a certain percentage of the fair market value that is determined by local assessors to be the total taxable value of land and additions on the property. | Land | Improvement |
|---|---|---|---|---|
| 2025 | $3,460 | $589,500 | $181,500 | $408,000 |
| 2024 | $3,366 | $536,000 | $165,000 | $371,000 |
| 2023 | $3,351 | $484,300 | $165,000 | $319,300 |
| 2022 | $3,209 | $398,600 | $126,800 | $271,800 |
| 2021 | $2,938 | $345,600 | $121,300 | $224,300 |
| 2020 | $2,873 | $334,500 | $110,200 | $224,300 |
| 2019 | $2,774 | $324,100 | $110,200 | $213,900 |
| 2018 | $2,676 | $311,200 | $110,200 | $201,000 |
| 2017 | $2,588 | $303,400 | $110,200 | $193,200 |
| 2016 | $2,539 | $303,400 | $110,200 | $193,200 |
| 2015 | $2,485 | $303,400 | $110,200 | $193,200 |
| 2014 | $2,513 | $308,400 | $116,000 | $192,400 |
Source: Public Records
Map
Nearby Homes