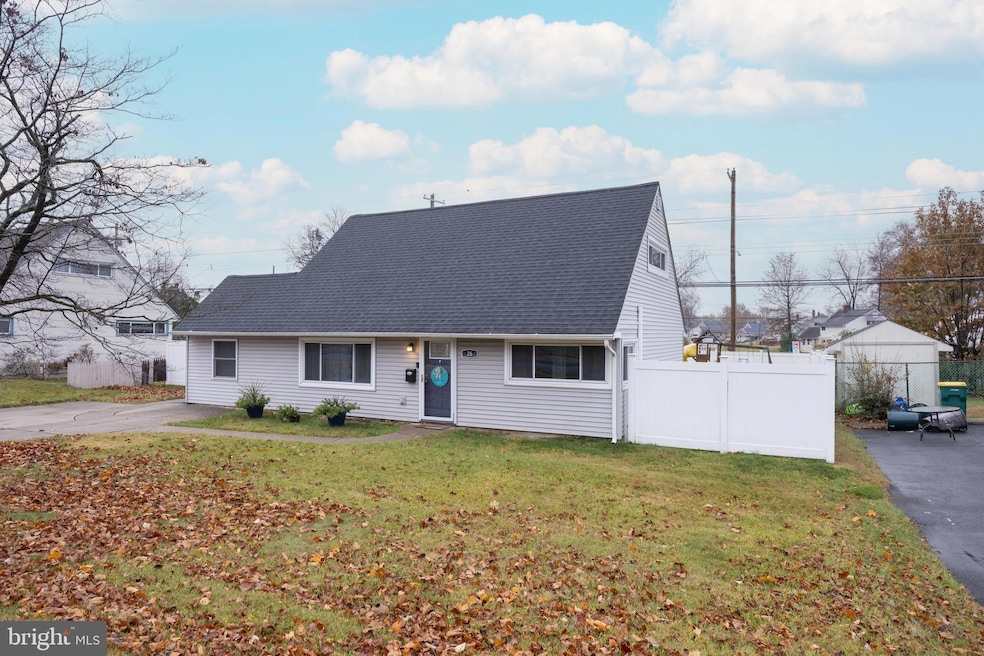
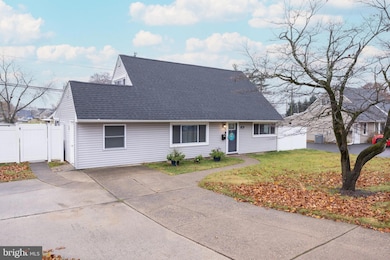
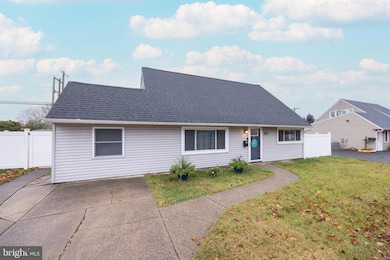
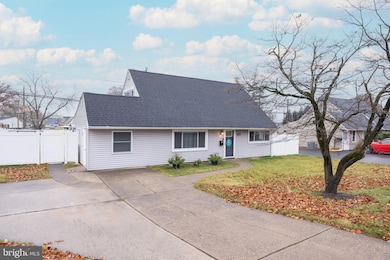
26 Queen Lily Rd Levittown, PA 19057
Estimated payment $2,604/month
Highlights
- Cape Cod Architecture
- Recessed Lighting
- Hot Water Heating System
- No HOA
- Central Air
About This Home
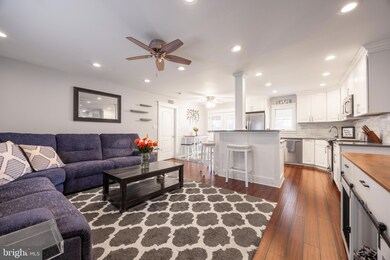
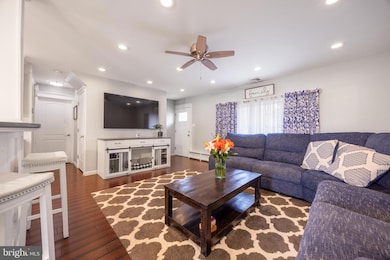
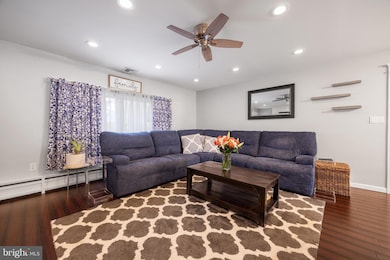
Welcome to 26 Queen Lily, a stunning, fully renovated 3-bedroom, 2-bathroom Cape Cod in Levittown's desirable Quincy Hollow. This home is completely move-in ready and features a luxurious, updated kitchen with white shaker cabinetry, granite countertops, stainless steel appliances, and a large central island perfect for entertaining. The open first floor boasts rich wood flooring and recessed lighting. Upstairs, you'll find a private primary suite with its own beautifully renovated full bathroom. Summer comfort is provided by the central air, and the exterior offers a private oasis with a white vinyl privacy fence. Combining a prime location in the acclaimed Neshaminy School District with beautiful finishes, this property is a must-see.
Listing Agent
(215) 499-4235 apinto@bucksremax.com RE/MAX Properties - Newtown License #RS300086 Listed on: 11/20/2025

Home Details
Home Type
- Single Family
Est. Annual Taxes
- $4,387
Year Built
- Built in 1956
Lot Details
- 9,000 Sq Ft Lot
- Lot Dimensions are 75.00 x 120.00
- Property is zoned R2
Parking
- Driveway
Home Design
- Cape Cod Architecture
- Slab Foundation
- Frame Construction
Interior Spaces
- 1,550 Sq Ft Home
- Property has 2 Levels
- Recessed Lighting
Bedrooms and Bathrooms
Utilities
- Central Air
- Hot Water Heating System
- Natural Gas Water Heater
Community Details
- No Home Owners Association
- Quincy Hollow Subdivision
Listing and Financial Details
- Tax Lot 170
- Assessor Parcel Number 22-064-170
Map
Home Values in the Area
Average Home Value in this Area
Tax History
| Year | Tax Paid | Tax Assessment Tax Assessment Total Assessment is a certain percentage of the fair market value that is determined by local assessors to be the total taxable value of land and additions on the property. | Land | Improvement |
|---|---|---|---|---|
| 2025 | $4,186 | $19,230 | $3,960 | $15,270 |
| 2024 | $4,186 | $19,230 | $3,960 | $15,270 |
| 2023 | $4,120 | $19,230 | $3,960 | $15,270 |
| 2022 | $4,012 | $19,230 | $3,960 | $15,270 |
| 2021 | $4,012 | $19,230 | $3,960 | $15,270 |
| 2020 | $3,964 | $19,230 | $3,960 | $15,270 |
| 2019 | $3,875 | $19,230 | $3,960 | $15,270 |
| 2018 | $3,804 | $19,230 | $3,960 | $15,270 |
| 2017 | $3,707 | $19,230 | $3,960 | $15,270 |
| 2016 | $3,707 | $19,230 | $3,960 | $15,270 |
| 2015 | $3,896 | $19,230 | $3,960 | $15,270 |
| 2014 | $3,896 | $19,230 | $3,960 | $15,270 |
Property History
| Date | Event | Price | List to Sale | Price per Sq Ft | Prior Sale |
|---|---|---|---|---|---|
| 11/20/2025 11/20/25 | For Sale | $425,000 | +157.6% | $274 / Sq Ft | |
| 11/22/2016 11/22/16 | Sold | $165,000 | -2.9% | $106 / Sq Ft | View Prior Sale |
| 10/05/2016 10/05/16 | Pending | -- | -- | -- | |
| 09/14/2016 09/14/16 | Price Changed | $169,900 | -10.5% | $110 / Sq Ft | |
| 08/30/2016 08/30/16 | Price Changed | $189,899 | 0.0% | $123 / Sq Ft | |
| 08/26/2016 08/26/16 | For Sale | $189,900 | -- | $123 / Sq Ft |
Purchase History
| Date | Type | Sale Price | Title Company |
|---|---|---|---|
| Deed | $165,000 | Cross Keys Abstract & Assura | |
| Quit Claim Deed | -- | -- | |
| Deed | $38,000 | -- |
Mortgage History
| Date | Status | Loan Amount | Loan Type |
|---|---|---|---|
| Open | $160,050 | New Conventional |
Source: Bright MLS
MLS Number: PABU2109838
APN: 22-064-170
Disclaimer: Certain information contained herein is derived from information provided by parties other than Homes.com. All information provided is deemed reliable, but is not guaranteed to be accurate and should be independently verified.
![]() The data relating to real estate for sale on this website appears in part through the BRIGHT Internet Data Exchange program, a voluntary cooperative exchange of property listing data between licensed real estate brokerage firms, and is provided by BRIGHT through a licensing agreement.
The data relating to real estate for sale on this website appears in part through the BRIGHT Internet Data Exchange program, a voluntary cooperative exchange of property listing data between licensed real estate brokerage firms, and is provided by BRIGHT through a licensing agreement.
Listing information is from various brokers who participate in the Bright MLS IDX program and not all listings may be visible on the site.
The property information being provided on or through the website is for the personal, non-commercial use of consumers and such information may not be used for any purpose other than to identify prospective properties consumers may be interested in purchasing.
Some properties which appear for sale on the website may no longer be available because they are for instance, under contract, sold or are no longer being offered for sale.
Property information displayed is deemed reliable but is not guaranteed.
Copyright 2025 Bright MLS, Inc.
- 58 Queen Lily Rd
- 35 Inland Rd
- 57 Island Rd
- 331 Indian Creek Dr
- 17 Quay Rd
- 14 Iris Rd
- 16 Iris Rd
- 7 Canal Rd
- 14 Cinnamon Rd
- 101 Idlewild Rd
- 62 Indian Creek Dr
- 14 Cleft Rock Rd
- 84 Whitewood Dr
- 23 Crystal Place
- 86 Wildflower Rd
- 94 Juniper Dr
- L235.17 Edgely Rd
- 154 Juniper Dr
- 212 Plumbridge Dr
- 33 Red Rose Way
- 12 Indigo Rd
- 15 Queen Anne Rd
- 99 Indian Creek Pass
- 10 Blue Ridge Dr
- 24 Rose Apple Rd
- 84 Whitewood Dr
- 35 Red Berry Rd
- 3501 Bristol Oxford Valley Rd
- 3401 Bristol Oxford Valley Rd
- 77 Fieldstone Rd
- 602 Hidden Forest Ct
- 1970 Veterans Hwy
- 2180 Veterans Hwy
- 209 Yorkshire Rd
- 51 Seckelpear Rd
- 1338 Veterans Hwy
- 2132 Durham Rd
- 5732 Mitchell Rd
- 5706 Mitchell Rd
- 1228 New Rodgers Rd