
Landlord's Agent in 2024
Nancy Xie
Virtual Properties Realty.com
(404) 360-8888
1 in this area
34 Total Sales
Estimated Value: $365,675 - $402,000
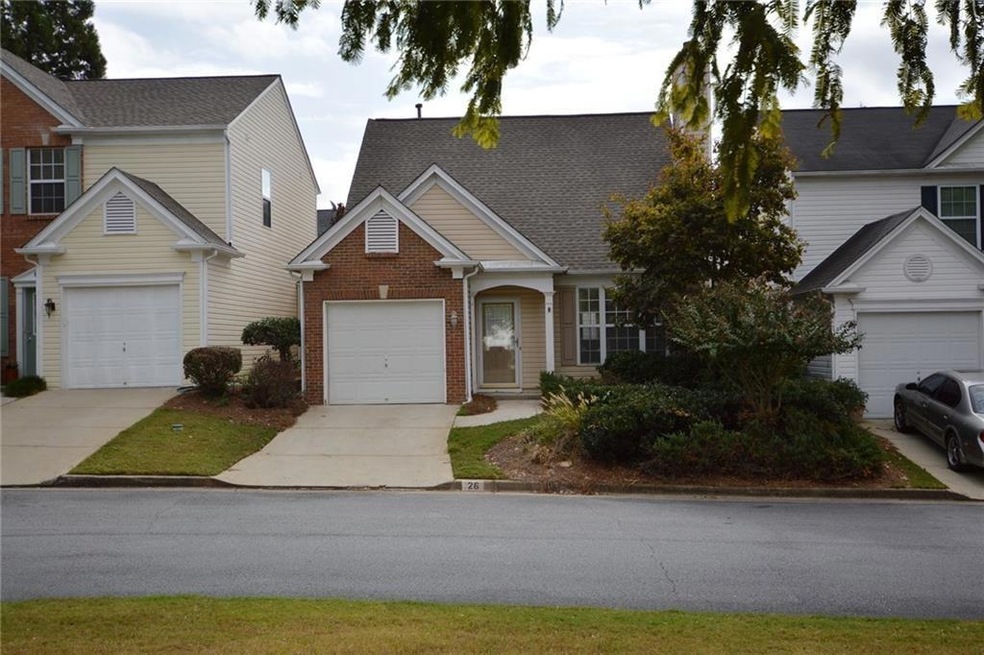
Brand new flooring ,and newer interior painting ,Stainless steel appliances!Beautiful home in the heart of Alpharetta. Master Bedroom on the Main Level. Big loft, Another large Bedroom upstairs with Full Bath and Loft/Den/Bonus Room area. Great roommate plan! Kitchen is open to the FamilyRoom. Active Swim/Tennis Neighborhood. Close to Restaurants, Shopping, East Roswell Park, Newtown Park, and Major Highways. move in ready!
Last Agent to Rent the Property
Virtual Properties Realty.com License #351225 Listed on: 08/12/2024
Last Renter's Agent
NON-MLS NMLS
Non FMLS Member
| Date | Buyer | Sale Price | Title Company |
|---|---|---|---|
| Ge Chenghao | $160,000 | -- | |
| Borgmann Andrew N | $177,000 | -- |
| Date | Status | Borrower | Loan Amount |
|---|---|---|---|
| Previous Owner | Borgmann Andrew N | $168,150 |
| Date | Event | Price | List to Sale | Price per Sq Ft | Prior Sale |
|---|---|---|---|---|---|
| 08/30/2024 08/30/24 | Rented | $2,000 | -4.8% | -- | |
| 08/20/2024 08/20/24 | Price Changed | $2,100 | -4.5% | $2 / Sq Ft | |
| 08/12/2024 08/12/24 | For Rent | $2,200 | +57.1% | -- | |
| 12/14/2019 12/14/19 | Rented | $1,400 | -6.7% | -- | |
| 11/27/2019 11/27/19 | Off Market | $1,500 | -- | -- | |
| 10/12/2019 10/12/19 | Price Changed | $1,500 | -6.3% | $1 / Sq Ft | |
| 10/07/2019 10/07/19 | For Rent | $1,600 | 0.0% | -- | |
| 09/13/2013 09/13/13 | Sold | $160,000 | -4.8% | $117 / Sq Ft | View Prior Sale |
| 09/04/2013 09/04/13 | For Sale | $168,000 | -- | $123 / Sq Ft |
| Year | Tax Paid | Tax Assessment Tax Assessment Total Assessment is a certain percentage of the fair market value that is determined by local assessors to be the total taxable value of land and additions on the property. | Land | Improvement |
|---|---|---|---|---|
| 2025 | $664 | $135,560 | $23,080 | $112,480 |
| 2023 | $3,787 | $134,160 | $19,440 | $114,720 |
| 2022 | $3,087 | $117,320 | $17,640 | $99,680 |
| 2021 | $2,892 | $90,800 | $11,760 | $79,040 |
| 2020 | $2,787 | $85,120 | $11,640 | $73,480 |
| 2019 | $414 | $83,640 | $11,440 | $72,200 |
| 2018 | $1,953 | $69,200 | $8,480 | $60,720 |
| 2017 | $1,683 | $57,680 | $8,680 | $49,000 |
| 2016 | $1,683 | $57,680 | $8,680 | $49,000 |
| 2015 | $1,499 | $57,680 | $8,680 | $49,000 |
| 2014 | $1,319 | $43,040 | $9,160 | $33,880 |
Landlord's Agent in 2024
Nancy Xie
Virtual Properties Realty.com
(404) 360-8888
1 in this area
34 Total Sales
N
Tenant's Agent in 2024
NON-MLS NMLS
Non FMLS Member
K
Seller Co-Listing Agent in 2019
Kevin Lu
Georgia Realty Brokers International Corporation
(770) 626-1819
1 Total Sale
N
Buyer's Agent in 2019
Nick Kittles
EXP Realty, LLC.
Seller's Agent in 2013
Christina Reinsel
Mission Homes Realty
(770) 294-2942
1 in this area
47 Total Sales
Buyer's Agent in 2013
Linda A Brown
Coldwell Banker Realty
(404) 874-2262
20 Total Sales
Source: First Multiple Listing Service (FMLS)
MLS Number: 7437229
APN: 12-2930-0822-122-4
![]() Listings identified with the FMLS IDX logo come from FMLS and are held by brokerage firms other than the owner of this website. The listing brokerage is identified in any listing details. Information is deemed reliable but is not guaranteed. If you believe any FMLS listing contains material that infringes your copyrighted work please visit www.fmls.com/dmca to review our DMCA policy and learn how to submit a takedown request. © 2025 First Multiple Listing Service, Inc.
Listings identified with the FMLS IDX logo come from FMLS and are held by brokerage firms other than the owner of this website. The listing brokerage is identified in any listing details. Information is deemed reliable but is not guaranteed. If you believe any FMLS listing contains material that infringes your copyrighted work please visit www.fmls.com/dmca to review our DMCA policy and learn how to submit a takedown request. © 2025 First Multiple Listing Service, Inc.
Disclaimer: Certain information contained herein is derived from information provided by parties other than Homes.com. All information provided is deemed reliable, but is not guaranteed to be accurate and should be independently verified.