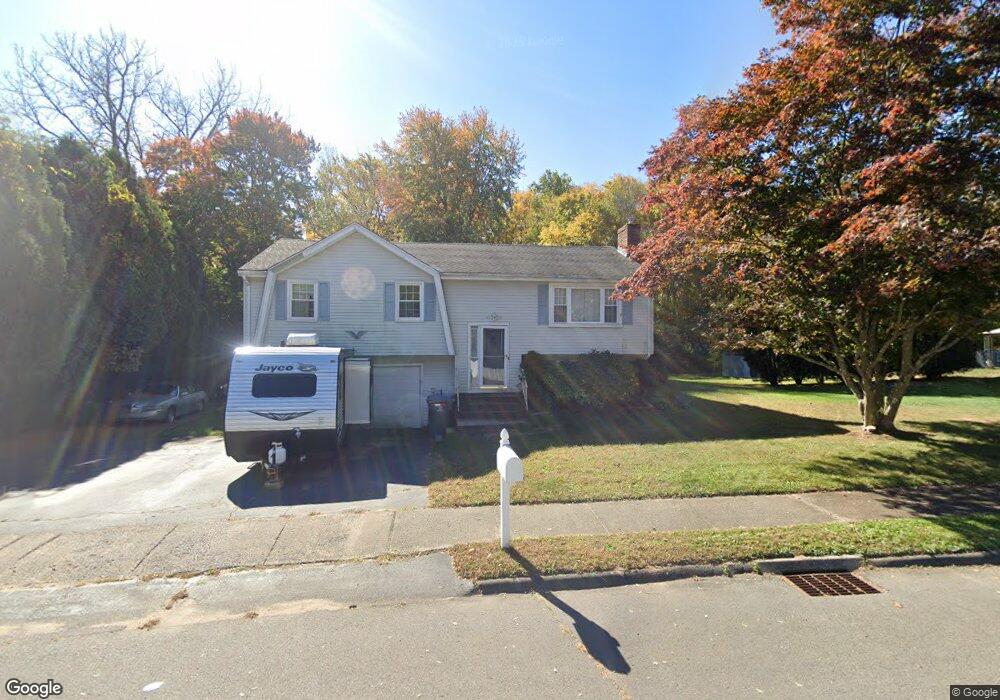
26 Richard Ct Bristol, CT 06010
North Bristol NeighborhoodEstimated Value: $386,000 - $415,150
3
Beds
2
Baths
1,288
Sq Ft
$311/Sq Ft
Est. Value
About This Home
This home is located at 26 Richard Ct, Bristol, CT 06010 and is currently estimated at $400,788, approximately $311 per square foot. 26 Richard Ct is a home located in Hartford County with nearby schools including Ivy Drive School, Northeast Middle School, and Bristol Eastern High School.
Ownership History
Date
Name
Owned For
Owner Type
Purchase Details
Closed on
Mar 14, 2007
Sold by
Cyr Jason and Cyr Jacquelyn
Bought by
Bartley David and Bartley Amanda
Current Estimated Value
Home Financials for this Owner
Home Financials are based on the most recent Mortgage that was taken out on this home.
Original Mortgage
$233,754
Interest Rate
6.4%
Purchase Details
Closed on
May 1, 2001
Sold by
Rose Arthur E and Rose Wanda A
Bought by
Cyr Jason and Cyr Jacqueline
Create a Home Valuation Report for This Property
The Home Valuation Report is an in-depth analysis detailing your home's value as well as a comparison with similar homes in the area
Home Values in the Area
Average Home Value in this Area
Purchase History
| Date | Buyer | Sale Price | Title Company |
|---|---|---|---|
| Bartley David | $237,500 | -- | |
| Cyr Jason | $173,000 | -- |
Source: Public Records
Mortgage History
| Date | Status | Borrower | Loan Amount |
|---|---|---|---|
| Open | Cyr Jason | $214,665 | |
| Closed | Cyr Jason | $233,754 | |
| Closed | Cyr Jason | $233,754 |
Source: Public Records
Tax History Compared to Growth
Tax History
| Year | Tax Paid | Tax Assessment Tax Assessment Total Assessment is a certain percentage of the fair market value that is determined by local assessors to be the total taxable value of land and additions on the property. | Land | Improvement |
|---|---|---|---|---|
| 2025 | $7,163 | $212,240 | $54,950 | $157,290 |
| 2024 | $6,760 | $212,240 | $54,950 | $157,290 |
| 2023 | $6,441 | $212,240 | $54,950 | $157,290 |
| 2022 | $5,766 | $150,360 | $38,150 | $112,210 |
| 2021 | $5,766 | $150,360 | $38,150 | $112,210 |
| 2020 | $5,766 | $150,360 | $38,150 | $112,210 |
| 2019 | $5,721 | $150,360 | $38,150 | $112,210 |
| 2018 | $5,545 | $150,360 | $38,150 | $112,210 |
| 2017 | $5,337 | $148,120 | $54,530 | $93,590 |
| 2016 | $5,337 | $148,120 | $54,530 | $93,590 |
| 2015 | $5,126 | $148,120 | $54,530 | $93,590 |
| 2014 | $5,126 | $148,120 | $54,530 | $93,590 |
Source: Public Records
Map
Nearby Homes